An exploration of water quality, water sources and topography in Google Earth. Produced for the Idaho Department of Environmental Quality Children’s Outreach Program (Kasey Guthrie, Pocatello, ID).
Interactive Water Quality Data Displayed in Google Earth

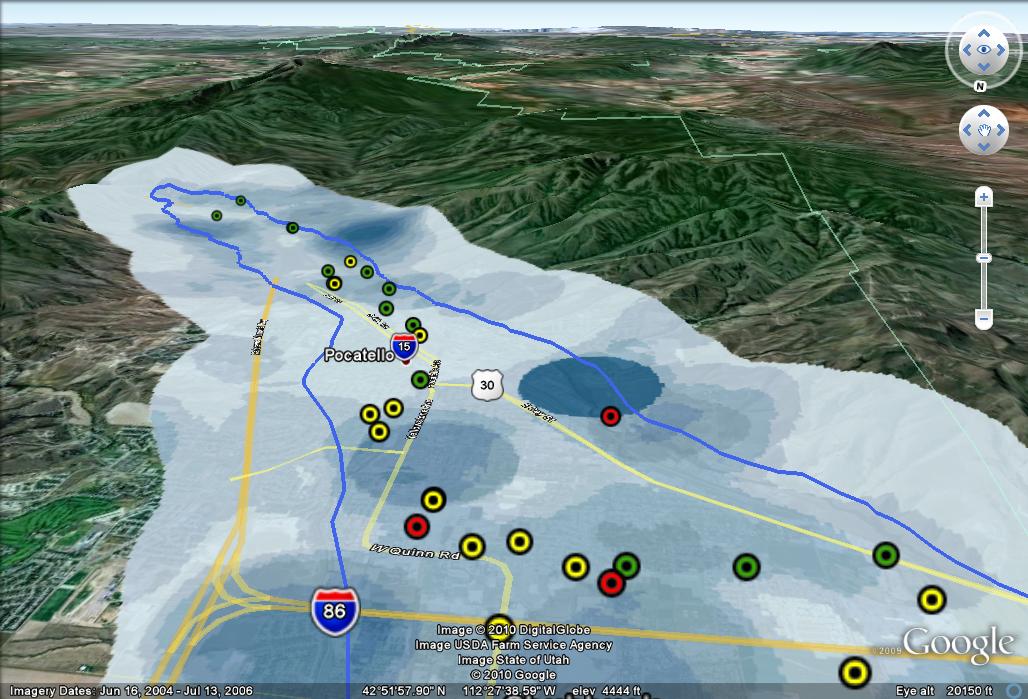
We have displayed three different datasets in Google Earth for 3D interactive exploration of water quality in the Pocatello area.
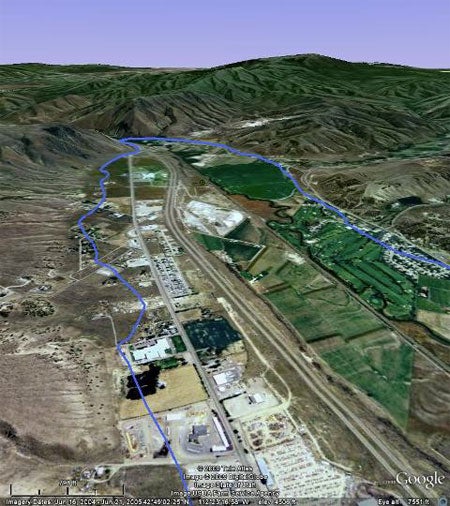
- The boundary of the Lower Portneuf river valley aquifer is displayed as a thick blue line.
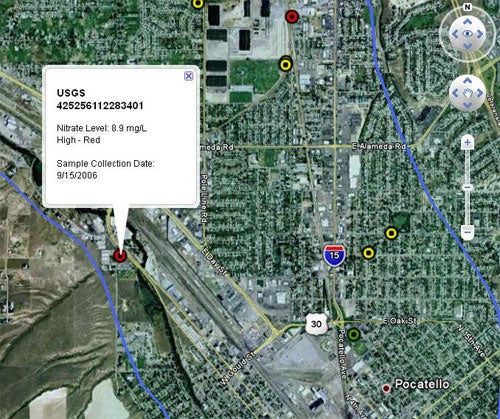
- Selected IDEQ and USGS wells are displayed as points with nitrate values collected in 2006. Wells are colored green for low nitrate values, yellow for medium, and red for high. The student can click on any well point for more information.
- Septic permit density is shown using an image that is dark blue in areas of higher density and light blue in areas of lower density.

Students can use Google Earth to explore the data, answer questions and prompt discussion. Google earth is available as a free download. Some example questions are given below. Click on the questions to show/hide the answers.
[toggle title=”Q: What is the name of the well with the highest nitrate value?”]A:
[/toggle]
[toggle title=”Q: What do you see under the areas with a high density of septic permits? To answer this zoom into one or more of the dark blue areas and toggle the density image on and off.”]
A: Neighborhoods, industrial areas
[/toggle]
[toggle title=”Q: What do you see under the areas with a low density of septic permits? To answer this zoom into one or more of the light blue areas and toggle the density image on and off.”]
A: Farmland, parks
[/toggle]
[toggle title=”Q: In what area of the aquifer are there generally higher nitrate values?”]
A: In the middle and northern parts? Why? Does water in the aquifer move south to north?
[/toggle]
[toggle title=”Q: What features do you see at the edges of the aquifer boundary?”]
A: The aquifer is bounded by the hills on southern end.

[/toggle]
[toggle title=”Q: What can you see in Google earth in and around Pocatello?”]
A: Students can just have fun using Google Earth by looking around for places they recognize. They can see if these places are in the aquifer boundary, if there are wells nearby, and if the landmarks are in areas of low or high septic permit density.
[/toggle]
Project supported by NSF Idaho EPSCoR Program and by the National Science Foundation under award number EPS‐0814387.
Data References
- Meehan, C.W., 2005, Geochemistry of the southern Pocatello aquifer and its implications for aquifer recharge and contamination potential; npubl. Idaho State University M.S. thesis, 201 pp.
- USGS, IDWR, IDEQ, ISDA, 20070615, Nitrate Priority Wells (2007) Idaho: Idaho Department of Environmental Quality (IDEQ), Boise, ID. (http://insideidaho.org/, accessed February 2010)
- Google Earth Layers prepared in February 2010. https://www.boisestate.edu/bcal/
Project Contacts
Idaho Department of Environmental Quality
Ms. Kasey Guthrie
DEQ Pocatello
Regional Office
444 Hospital Way #300
Pocatello, ID 83201
208 236‐6160
kasey.guthrie@deq.idaho.gov
Idaho State University
Project developed by Sara Ehinger and Carol Moore, Department of Geosciences
Contact: Nancy Glenn, bcal@isu.edu
Boise Center Aerospace Laboratory
Department of Geosciences, Idaho State University
322 E. Front St., Suite 240
Boise, ID 83702
(208) 345‐1994