By Bella Pratt, Graduate Assistant and MBA Candidate

Last July, we reported on some of COVID-19’s effects on marginalized communities around the country and in Idaho, focusing mainly on African Americans, Hispanics, Indigenous people, and lower socioeconomic populations. In May when the article was first written, race and ethnicity data showed that “Hispanics make up 35% of the COVID-19 cases in the state… Black/African Americans currently make up about 2.2% of the cases, while Native Americans are at 1.5%”¹.
The original effects mentioned a year ago, including the disproportionate effect of COVID-19 on many marginalized populations around Idaho and the country, have been amplified. By re-evaluating the impacts a year in, we can see some of the long-term effects as well as give an update on the data originally given.
COVID-19 Cases and Deaths in Idaho (as of March 12th, 2021)
Hispanics
- Cases. Hispanics now account for 18.9% of the COVID-19 cases in the state, even though they are only 13% of the population. This is a decrease of 16.1% from May’s data, though still 5.9% higher than the total population².
- Deaths. Hispanics represent 10% of the COVID-19 deaths³.
Black/African Americans
- Cases. Black/African Americans now make up 0.9% of the cases. This is on par with the total population.4 This number was originally higher when reported in May¹.
- Deaths. Black/African Americans represent 0.5% of the COVID-19 deaths in Idaho³.
American Indian/Alaska Natives
- Cases. American Indian/Alaska Natives are at 1.7% of cases in Idaho, which is also on par with the total population.4 This number was originally higher when reported in May¹.
- Deaths. American Indian/Alaska Natives represent 1.9% of COVID-19 deaths³.
Other/Multiple Races
- Cases. Other Race or Multiple Race COVID-19’s percentage of cases comes in at 11.1% (8.5% higher than the total population)⁴.
- Deaths. Other Race/Multiple Race is at 2.2% of the COVID-19 deaths in the state³.
Whites
- Cases. Whites’ percentage of cases are at 84.9% in Idaho (8.1% lower than the total population)⁴.
- Deaths. Whites are 94.6% of the COVID-19 deaths³.
Asian
- Cases. Asians have relatively low case numbers at 1% (0.6% lower than the total population)⁴.
- Deaths. Asians currently make up 0.9% of the mortality rate in Idaho³.
Native Hawaiian/Other Pacific Islander
- Cases. Native Hawaiian or Other Pacific Islander is at 0.4% of cases in Idaho (0.2% higher than the total population) (“U.S. Census Bureau Quick Facts”)⁴.
- Deaths. Native Hawaiian/Other Pacific Islanders have not accounted for any of the deaths at this time³.
Finally, in Idaho, 11.2% of people were in poverty from 2015-2019, while 12.8% were uninsured⁵. This is lower than the 13.4% of people in poverty in the U.S. as a whole but higher than the 8.8% that were uninsured from 2015-2019⁶. These relatively similar numbers likely show that health coverage and poverty did not vary enough from the United States to heavily affect how lower socioeconomic communities were affected by COVID-19 in Idaho versus the country as a whole.
However, all of this data highlights the especially strong disparity between Hispanics’ and Other Race/Multiple Races’ COVID-19 cases in comparison to Whites’ numbers. Both of these groups together make up only about 16% of the population, but almost ⅓ of the cases in the state.
When looking at the statewide data overall, it seems that Whites also have a slightly higher mortality rate than their population percentage (1.6% higher) and the same with American Indian/Alaska Natives (0.2% higher). Meanwhile, Hispanics, Other Race/Multiple Races’, and Black/African Americans’ mortality rates are close to being on par with their population percentages (3% lower mortality rate for Hispanics, a 0.6% lower mortality rate for Other Race/Multiple Races, and a 0.4% lower mortality rate for Black/African Americans). See Table 1 below for more insight into this data⁷.
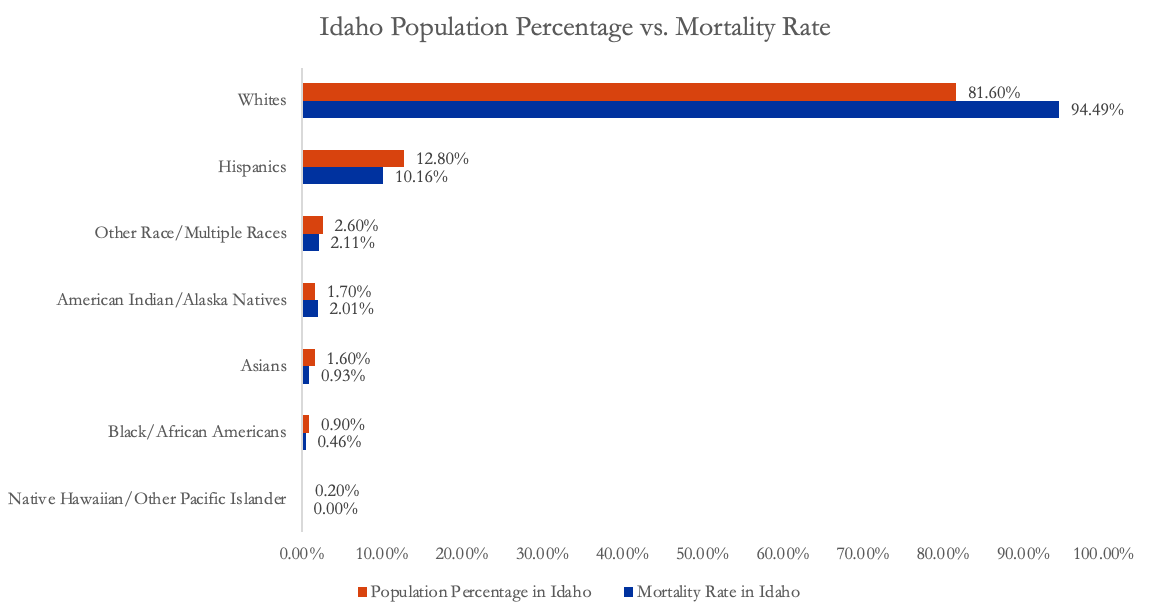
Table 1: Idaho’s population percentage by race and ethnicity as compared to mortality rate⁷.
When it comes to the United States numbers as a whole, Whites have a slightly lower mortality rate than their population percentage (1% lower) as well as Asians (1.2% lower than the population percentage), American Indian/Alaskan Natives (0.7% lower than the population percentage), and Native Hawaiian/Pacific Islanders (0.2% lower than the population percentage).
On the other hand, Hispanics have a slightly higher mortality rate than their population percentage (2.1% higher) as well as Blacks (2.4% higher than the population percentage). Since CDC’s numbers did not include Two or More Races as options, this group cannot be compared on a state basis to the national level. See Table 2 below for more nationwide statistics⁷.
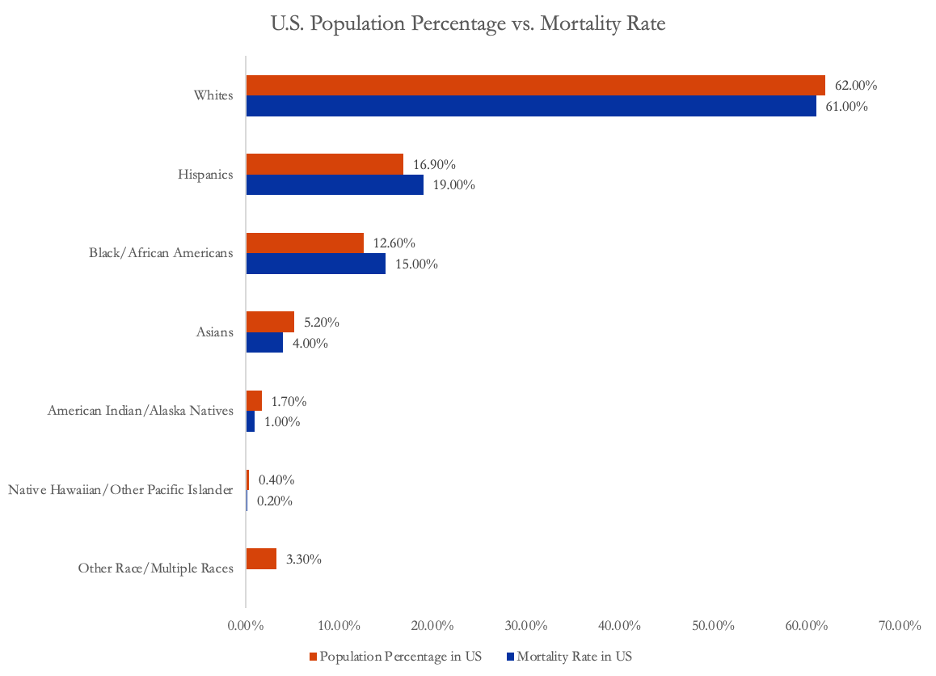
Table 2: U.S.’ population percentage by race and ethnicity as compared to mortality rate⁷.
Vaccine Administration in Idaho (as of March 12th, 2021)
While there is some statewide data on vaccine administration, the Idaho Division of Public Health notes that “Due to having so many records with race/ethnicity data missing, conclusions related to equity of vaccine administration cannot be drawn using this data.” For race, 31.4% of the total data thus far does not have race listed, while 42.9% of the total data does not have ethnicity listed (for Hispanic or Latino percentages)⁸.
As the Department of Health and Welfare Director Dave Jeppesen said, “Idaho and DHW are committed to transparency, but we also want to make sure the data we can provide has integrity.” He went on to say that race and ethnicity data is not required for patients to report, but when they do, it must be reported by vaccine providers⁹.
According to the task force chair of the COVID-19 Health Equity Task Force, Dr. Marcella Nunez-Smith, there was about half of vaccination-related race and ethnicity data missing nationwide as of January 30, 2021. “We cannot ensure an equitable vaccination program without data to guide us… But I’m worried about how behind we are. We must address these insufficient data points as an urgent priority.” There are many factors to blame, she went on to say, including irregular rollout among states and an “inconsistent emphasis on equity in the early days of vaccination.” As the We Must Count Coalition pointed out in their letters to the Trump and Biden administrations, “We cannot improve what we’re not willing to measure¹⁰.
In a joint editorial published in The Journal of the American Medical Associations, two physicians highlighted the importance of systems’ role in vaccine distribution. “Local health departments and health institutions need to respond to these data in real time to identify where COVID-19 vaccine uptake is not matching COVID-19 disease burden… If disparities emerge, then additional targeted approaches to vaccine outreach, education, and administration, for example, house to house contact, may be necessary”¹⁰.
Economic Impact
Even with these medically focused COVID-19 effects, there are some indicators that the economy is on the way to recovery within Idaho. For example, the unemployment rate fell about 7.1% percent, from 11.5% in April¹¹ to 4.4% in December¹². This, as well as the increase in consumer spending in Idaho (up 5.7% in February 2021 from January 2020)¹³, spells good news for groups that are most likely to be affected by the pandemic’s economic effects. These effects were most pronounced for non-white workers, lower-wage earners, women, and those who were less educated¹⁴.
This effect on those that make less money can be seen in the 22.6% decrease in low-wage employment rates in Idaho from December 2020 in comparison to January 2020. This is in stark comparison to the only 11% decrease in total employment across low, medium, and high-income levels¹⁵. Seeing that Hispanic, Black/African American, and female workers are overrepresented in the low-wage workers in comparison to their share of the workforce¹⁶, this marginalized demographic has likely been hit harder by the pandemic’s effect on unemployment.
Finally, as it relates to small businesses in Idaho, the total small business revenue increased 1.3% from January 2020 to January 2021¹⁷. However, there were 21.9% fewer small businesses open in January 2021 when compared to one year earlier¹⁸. This increase in revenue, but decreased number of businesses, affects many of Idaho’s minority population since there were 9,203 self-employed minorities in Idaho in 2020. This makes up about 10% of Idaho’s self-employment rate¹⁹.
Takeaway
These numbers highlight the continued importance of diversity, equity, and inclusion (DEI) work in Idaho and the challenge of dismantling systemic issues, as originally reported in July’s article. Last time around, there wasn’t a lot of data surrounding COVID-19’s effect on Idaho or how it disproportionately affects underrepresented populations.
However, it’s easy to see one year down the road that these effects have often been felt more heavily by marginalized groups within the state. The original words from our last article still ring true: “By focusing on diversity, equity and inclusion at a systemic level, not only can our community and our nation aid with COVID-19 recovery for those that are most struggling, but we can also aid with systemic inequality as a whole–the same inequality that set them up to be in that position in the first place.”
This is true not only of national, systemic DEI policies, some of which can be seen in our other newsletter article for this quarter, but also of the positive effects statewide or more localized policies and practices can have. If these actions are put in place by Idaho businesses, education, and government, some of the systemic barriers that marginalized groups in the state face can be lowered. This will aid with continued COVID-19 recovery in Idaho as well as setting up the state, and its diverse group of people, for long-term success and prosperity.
If you or someone you know is currently struggling with the economic effects of COVID-19, the Idaho Housing and Finance Association has a program in place to help renters affected by COVID-19. For financial assistance and business insight, Idaho Commerce’s page has many resources to assist, including loan forgiveness, COVID-19 specific loans, assistance to rural communities, and information and resources for small businesses.
References
- Originally cited in the July 2020 article. Idaho Division of Public Health. (2020, April). COVID-19 demographics. https://public.tableau.com/profile/idaho.division.of.public.health#!/vizhome/DPHIdahoCOVID-19Dashboard_V2/Story1
- Originally cited in the July 2020 article. Idaho Division of Public Health. (2020, April). COVID-19 demographics. https://public.tableau.com/profile/idaho.division.of.public.health#!/vizhome/DPHIdahoCOVID-19Dashboard_V2/Story1
See also: Idaho Division of Public Health. (2021, March). Statewide demographics. https://public.tableau.com/profile/idaho.division.of.public.health#!/vizhome/DPHIdahoCOVID-19Dashboard/Home - Idaho Division of Public Health. (2021, March). Deaths by demographics. https://public.tableau.com/profile/idaho.division.of.public.health#!/vizhome/DPHIdahoCOVID-19Dashboard/Home
- U.S. Department of Commerce. (2019, July). Quickfacts Idaho. United States Census Bureau. https://www.census.gov/quickfacts/ID See also: Idaho Division of Public Health. (2021, March). Statewide demographics. https://public.tableau.com/profile/idaho.division.of.public.health#!/vizhome/DPHIdahoCOVID-19Dashboard/Home
- U.S. Department of Commerce. (2019, July). Quickfacts Idaho. United States Census Bureau. https://www.census.gov/quickfacts/ID
- U.S. Department of Commerce (2019). American community survey. United States Census Bureau. https://www.census.gov/acs/www/data/data-tables-and-tools/narrative-profiles/2019/report.php?geotype=nation&usVal=us
- U.S. Department of Health & Human Services. (2021, March). COVID-19 mortality overview. CDC. https://www.cdc.gov/nchs/covid19/mortality-overview.htmSee also: Cedar Lake Ventures, Inc. (2018, September). Race and ethnicity in the United States. Statistical Atlas. https://statisticalatlas.com/United-States/Race-and-Ethnicity See also: Office of Minority Health Resource Center. (2020, January). Profile: Native Hawaiians/Pacific Islanders. https://minorityhealth.hhs.gov/omh/browse.aspx?lvl=3&lvlid=65 See also: Office of Minority Health Resource Center. (2021, January). Profile: American Indian/Alaska Native. https://minorityhealth.hhs.gov/omh/browse.aspx?lvl=3&lvlid=65 See also: Idaho Division of Public Health. (2021, March). Deaths by demographics. https://public.tableau.com/profile/idaho.division.of.public.health#!/vizhome/DPHIdahoCOVID-19Dashboard/Home
- Idaho Division of Public Health. (2021, March). COVID-19 vaccine data dashboard. https://public.tableau.com/profile/idaho.division.of.public.health#!/vizhome/COVID-19VaccineDataDashboard/Residence
- DHW Communications. (2021, March). Idaho providing race and ethnicity data on vaccine data dashboard starting today. Idaho Department of Health & Welfare. https://healthandwelfare.idaho.gov/news/idaho-providing-race-and-ethnicity-data-vaccine-data-dashboard-starting-today
- Hassanein, N. (2021, February). ‘It’s not a pretty picture’: Why the lack of racial data around COVID vaccines is ‘massive barrier’ to better distribution. USA Today. https://www.usatoday.com/story/news/health/2021/02/01/covid-19-data-obscures-race-ethnicity-vaccine-coronavirus-racial-equity/4318276001/
- Originally cited in the July 2020 article. Staats, D., & Sowell, J. (2020, April). Coronavirus’ shocking impact: Never before have so many Idahoans been out of work. Idaho Statesman. https://www.idahostatesman.com/article241890256.html
- Idaho Department of Labor. (2020, December). Unemployment insurance reports.
- Chetty, Friedman, Hendren, Stepner, & the OI Team. (2020). Percent change in all consumer spending. Opportunity Insights. https://tracktherecovery.org/
- Bauer, L., Broady, K., Edelberg, W., & O’Donnell, J. (2020, September). Ten facts about COVID-19 and the U.S. economy. The Brookings Institution.
- Chetty, Friedman, Hendren, Stepner, & the OI Team. (2020). Percent change in employment. Opportunity Insights. https://tracktherecovery.org/
- Ross, M., & Bateman, N. (2019, November). Meet the low-wage workforce. Metropolitan Policy Program at Brookings. https://www.brookings.edu/wp-content/uploads/2019/11/201911_Brookings-Metro_low-wage-workforce_Ross-Bateman.pdf#page=9
- Chetty, Friedman, Hendren, Stepner, & the OI Team. (2020). Percent change in small business revenue. Opportunity Insights. https://tracktherecovery.org/
- Chetty, Friedman, Hendren, Stepner, & the OI Team. (2020). Percent change in number of small businesses open. Opportunity Insights. https://tracktherecovery.org/
- U.S. Small Business Administration Office of Advocacy. (2020). Idaho small business profile.