Porosity
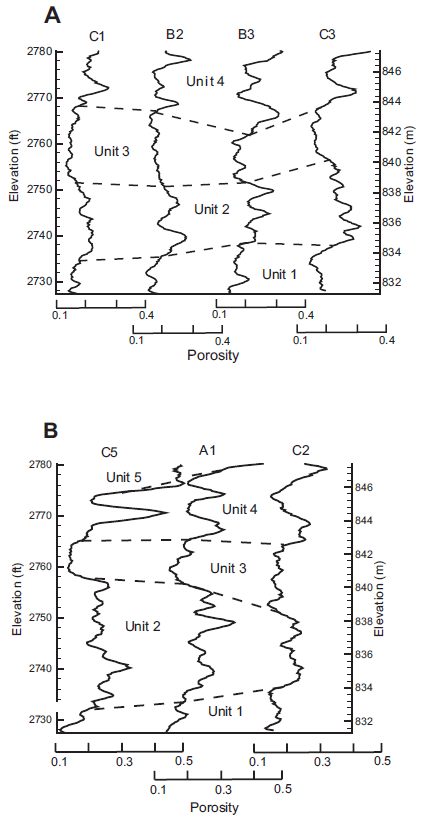
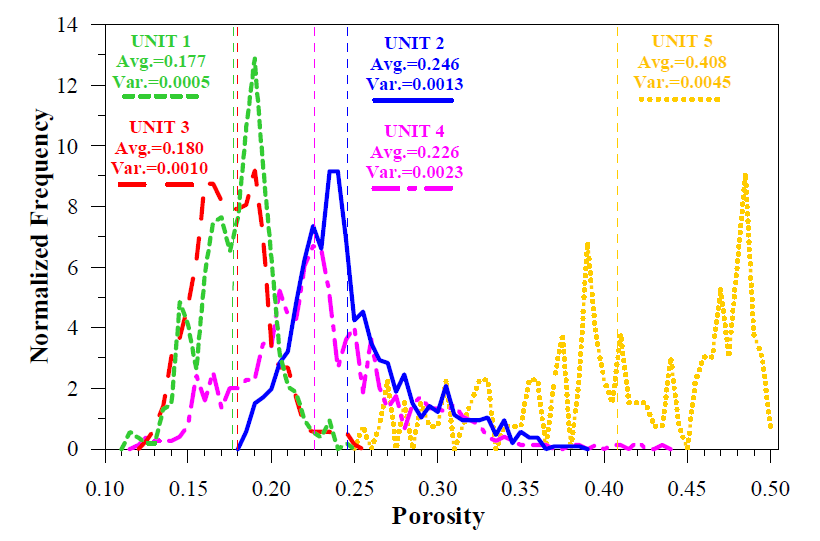
Porosity values (0.2 ft. intervals) were derived from neutron logs that were run in each well at the BHRS. Each interval was assigned a porosity value from the average of all neutron-derived porosity values within the sample interval. The values (and the resulting assigned units) can be seen in the cross-sections shown in Figure 1. The normalized frequency of values within the units are shown in Figure 2.
Hydraulic Parameters
Hydraulic conductivity (K), specific storage (Ss) and specific yield (Sy) were quantified from fully-penetrating pumping tests. Arithmetic mean for parameter values from analytical modeling of all pumping well-observation well pair data is presented in the table.
| Parameter | n | Mean | Maximum | Minimum | Units |
|---|---|---|---|---|---|
| Kr | 73 | 7.6×10⁻⁴ | 1.3×10⁻³ | 5.1×10⁻⁴ | m/sec |
| Kz | 73 | 6.6×10⁻⁴ | 1.3×10⁻³ | 3.8×10⁻⁵ | m/sec |
| Ss | 73 | 4.1×10⁻⁵ | 1.3×10⁻⁴ | 3.3×10⁻⁵ | m-1 |
| Sy | 73 | 0.036 | 0.070 | 0.013 | — |
Local variations (heterogeneity) in K were recognized in the unconfined aquifer and K distributions were developed based on results from the fully-penetrating pumping tests.
Sources and Further Reading
Fox 2007. Analytical modeling of fully penetrating pumping tests at the Boise Hydrogeophysical Research Site for aquifer parameters and wellbore skin. MS thesis, Boise State University.
Reboulet and Barrash 2003.Core, grain-size, and porosity data from the Boise Hydrogeophysical Research Site Boise, ID. BSU CGISS Technical Report.