Samantha Schauer, Dr. Eric Jankowski, Dr. Krishna Pakala, Dr. Sara Hagenah
Background
A strong sense of professional identity can be linked to retention and graduation rates. This study analyzed the professional identity of the current population of Boise State’s College of Engineering.
Methods
1. Survey was sent to all COEN students (over 2000), and we received 260 responses.
2. Students were asked 57 questions to look at four main categories
- Feelings of Recognition
- Interest in the Subject Confidence and
- Competence Definition of an “Engineer”
3. With demographic questions, the data could be sliced to analyze specific populations
Demographic Questions and Results
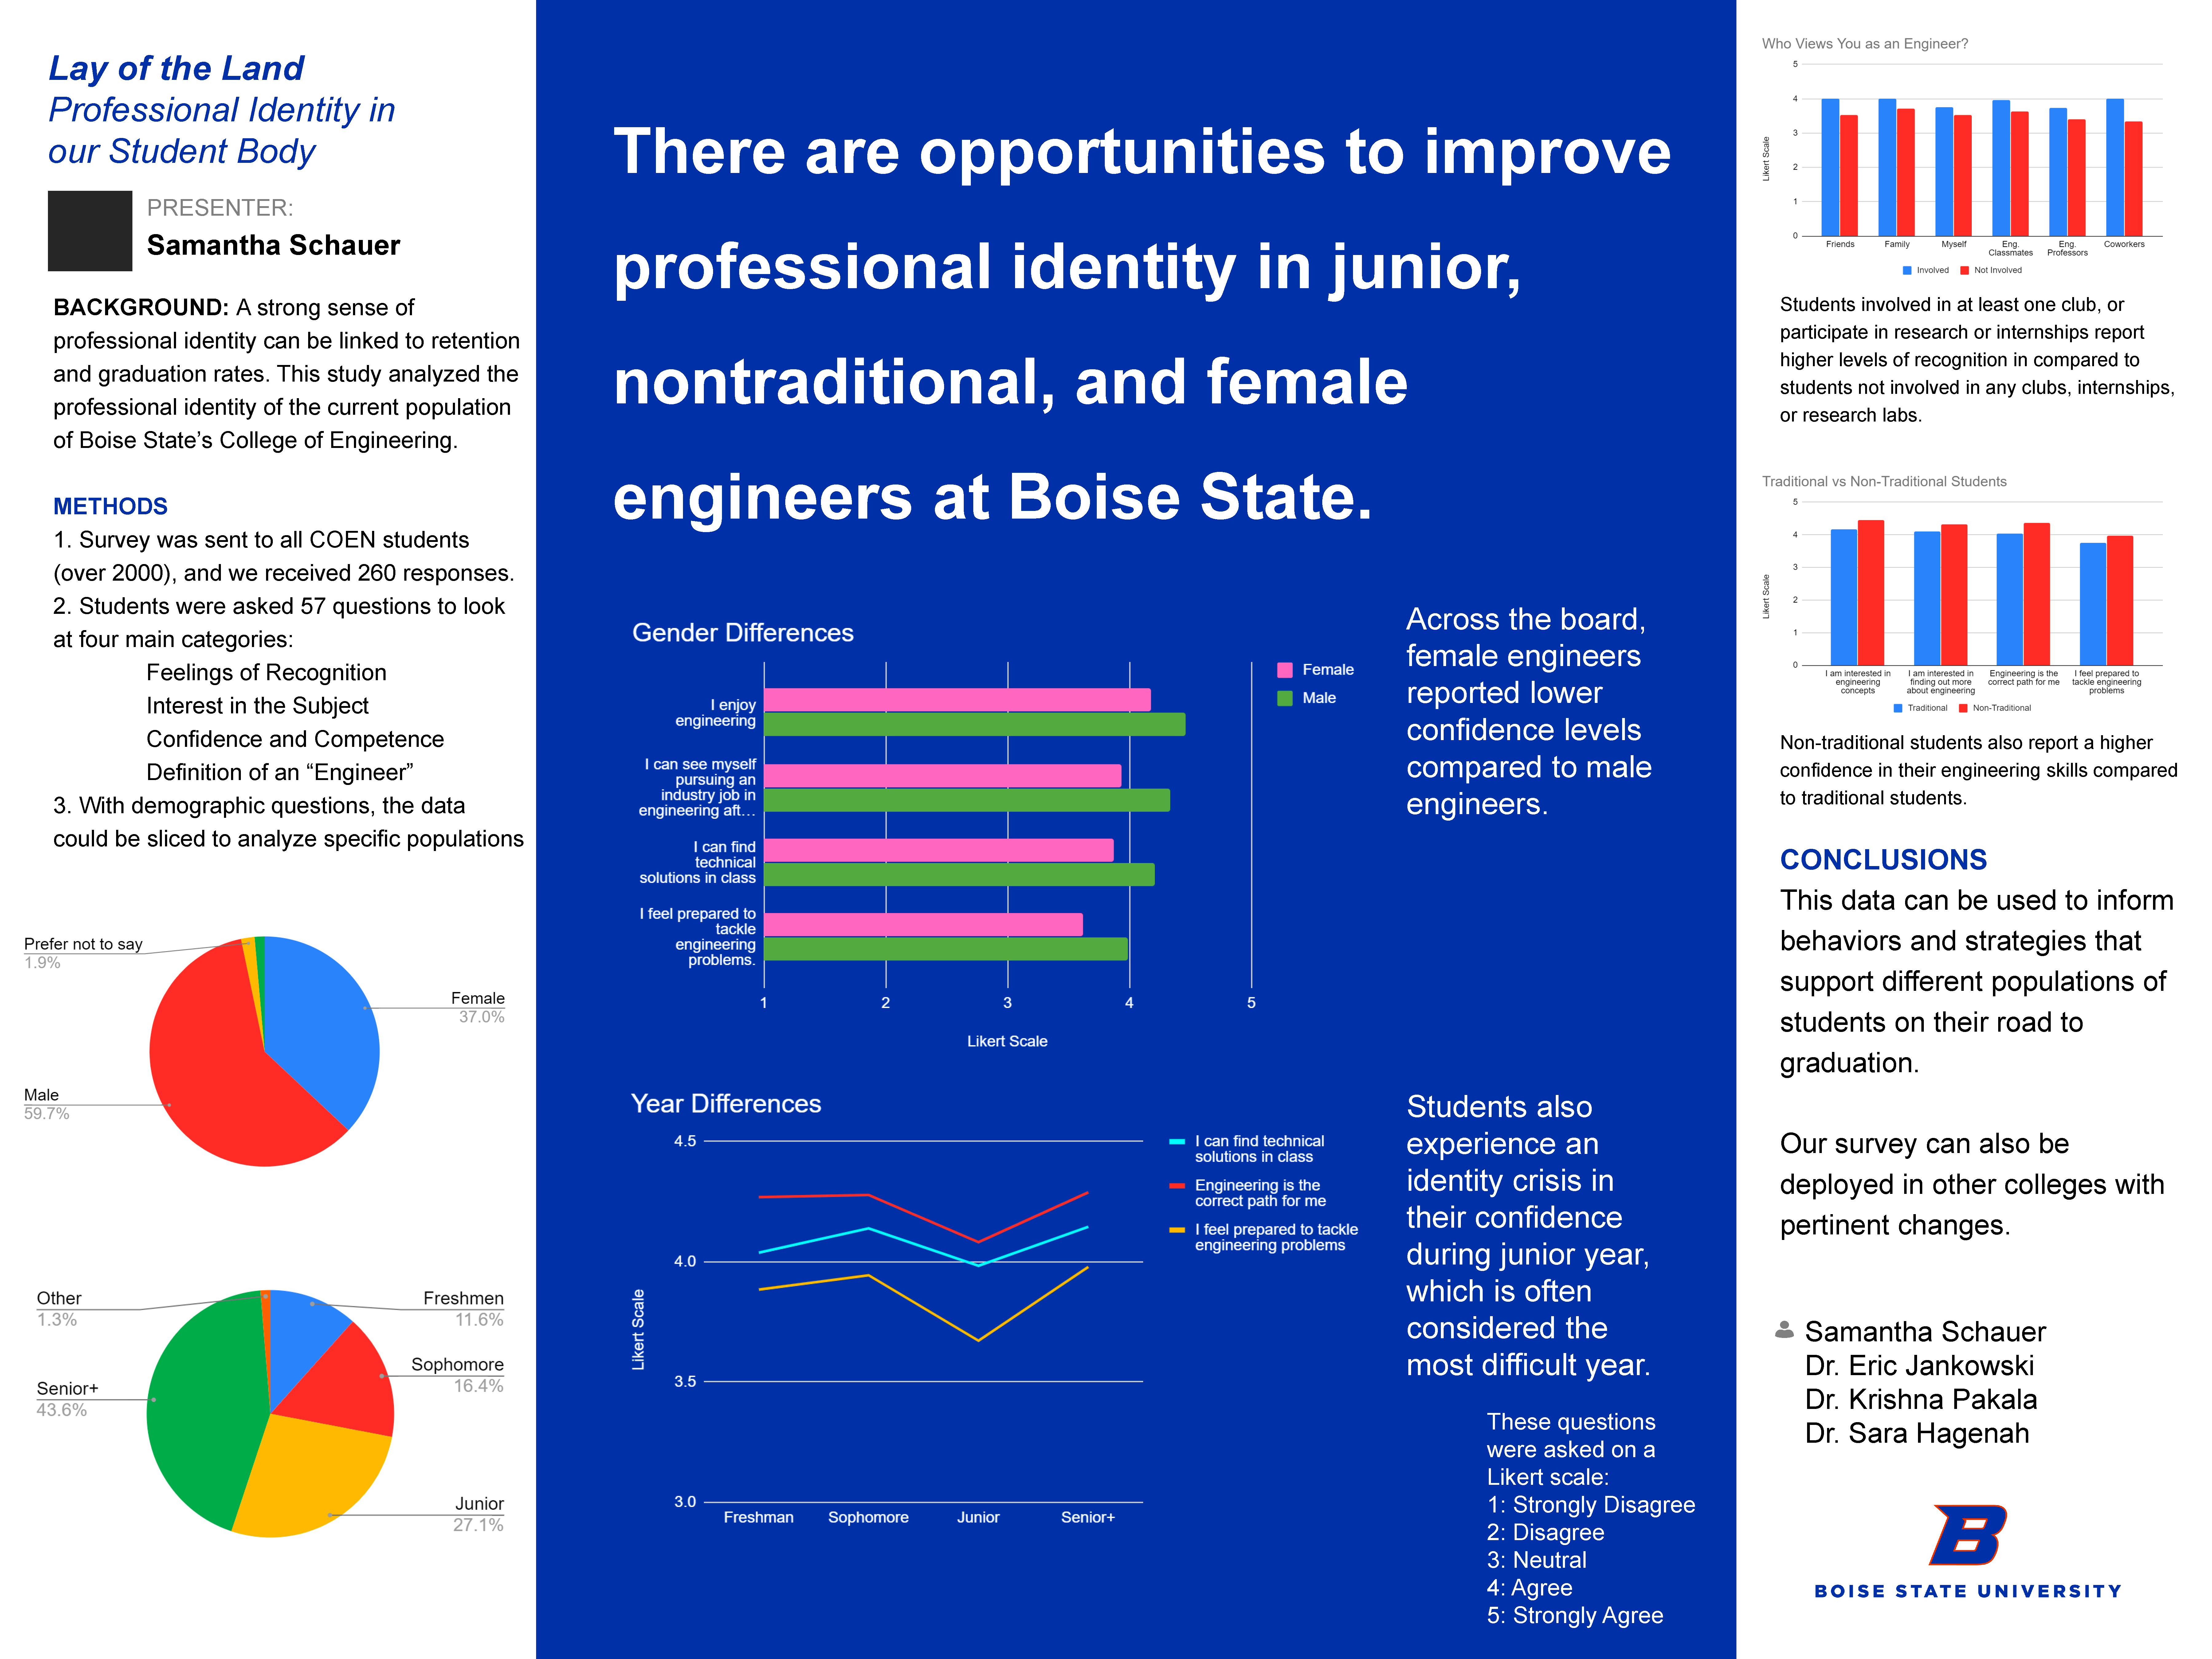
Gender
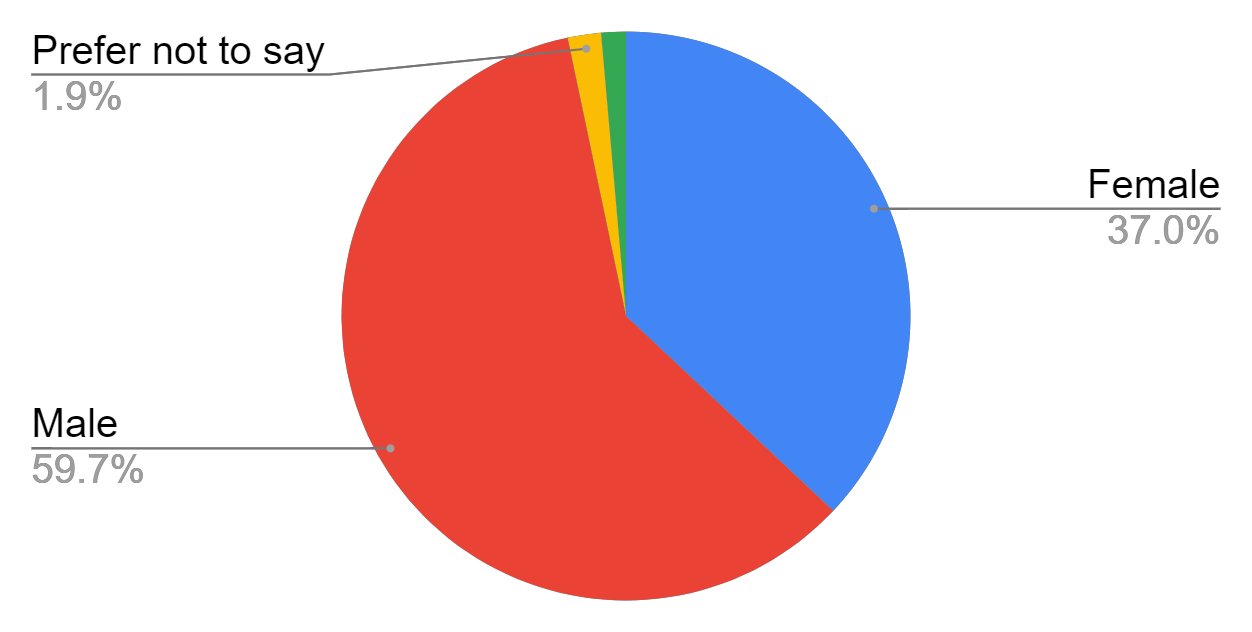
Class Standing
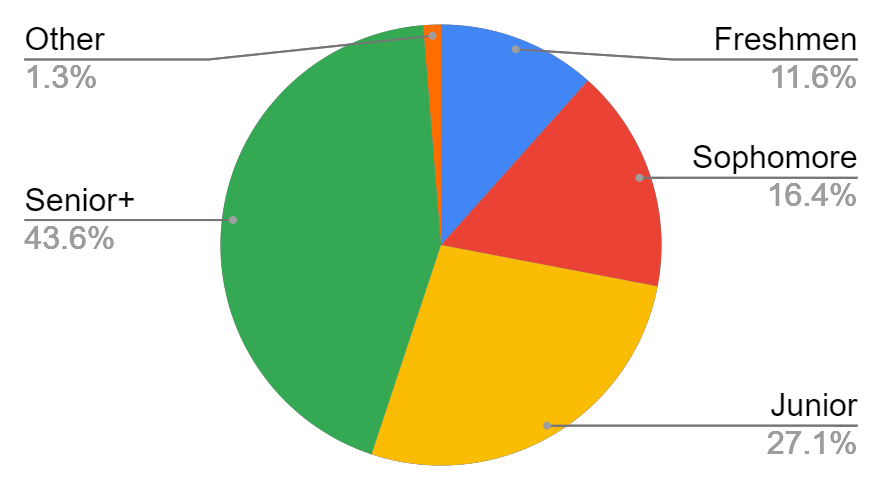
Who views you as an Engineer?
Traditional vs. Non-Traditional Students
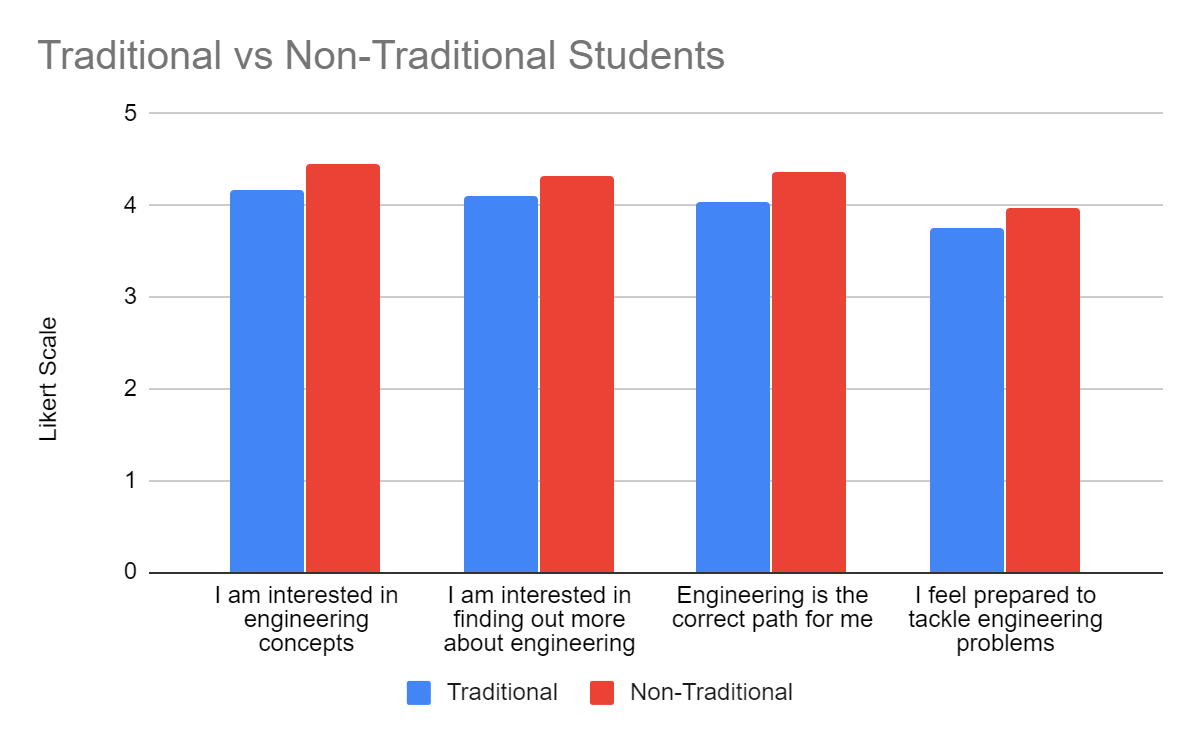
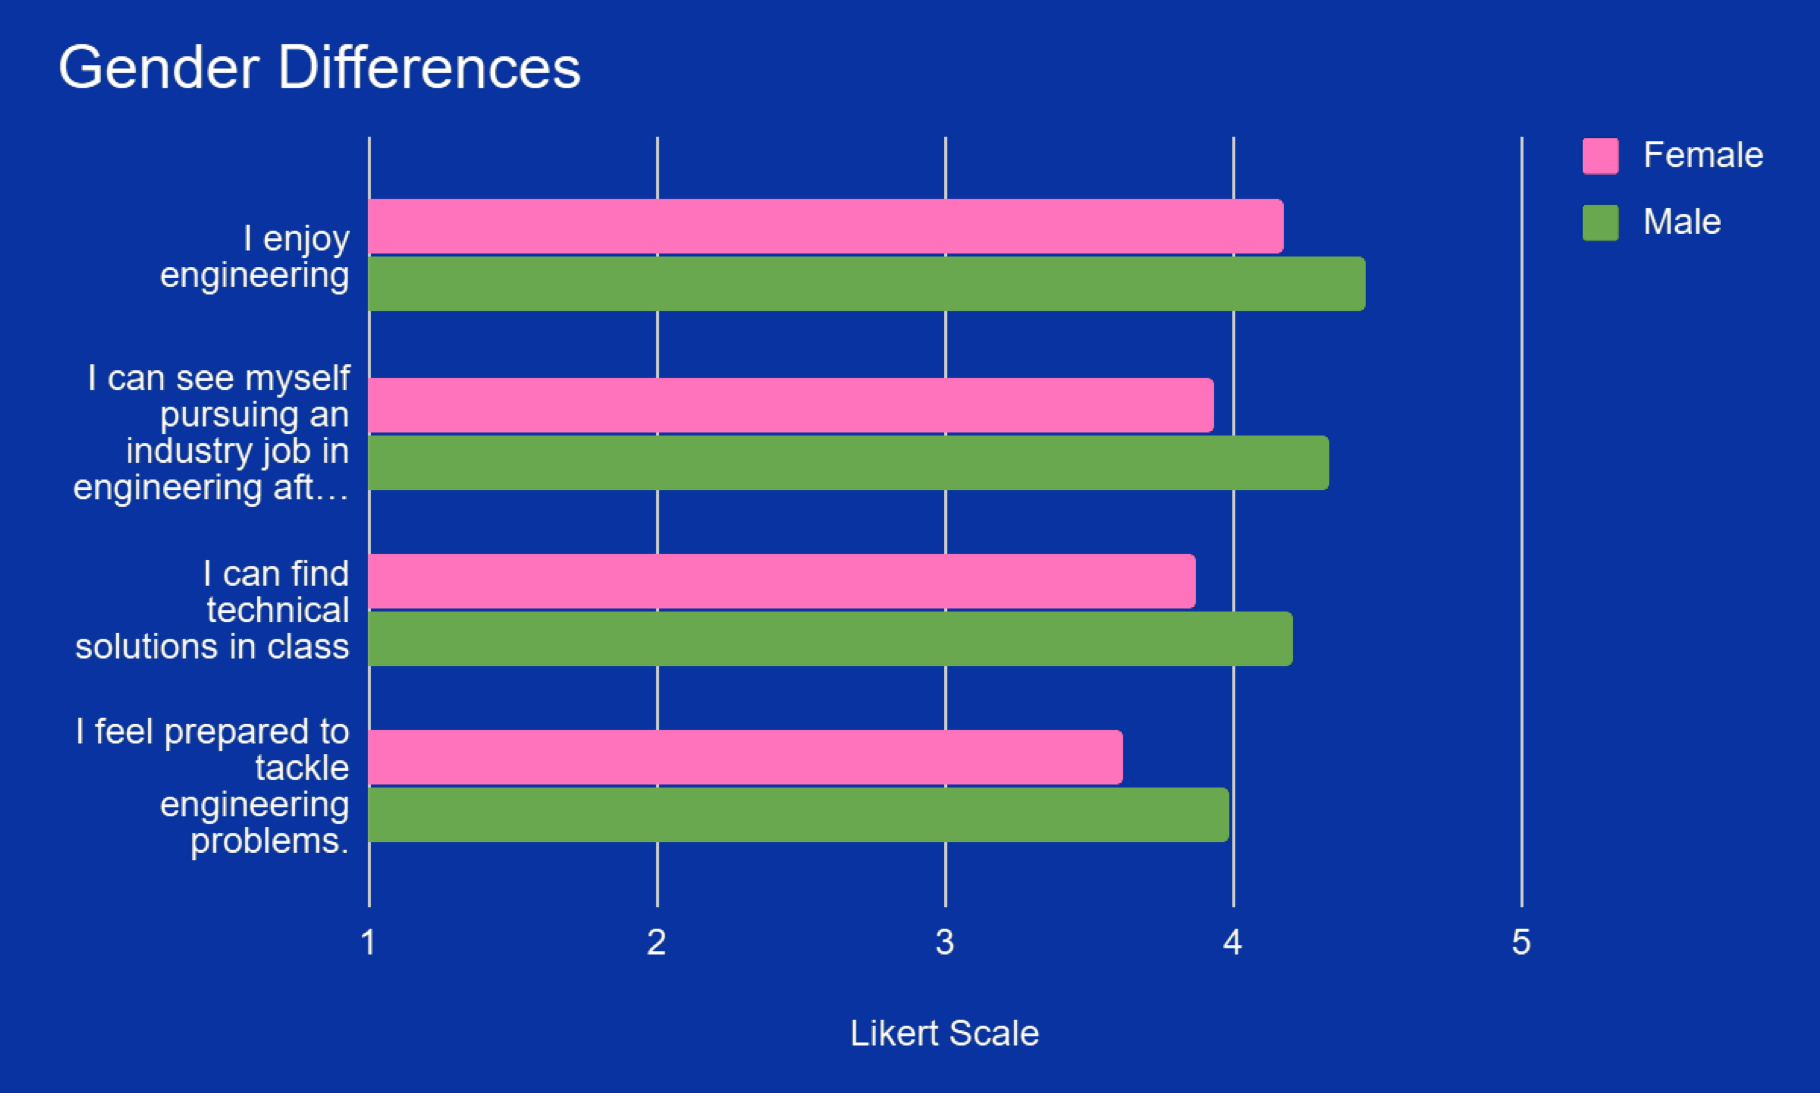
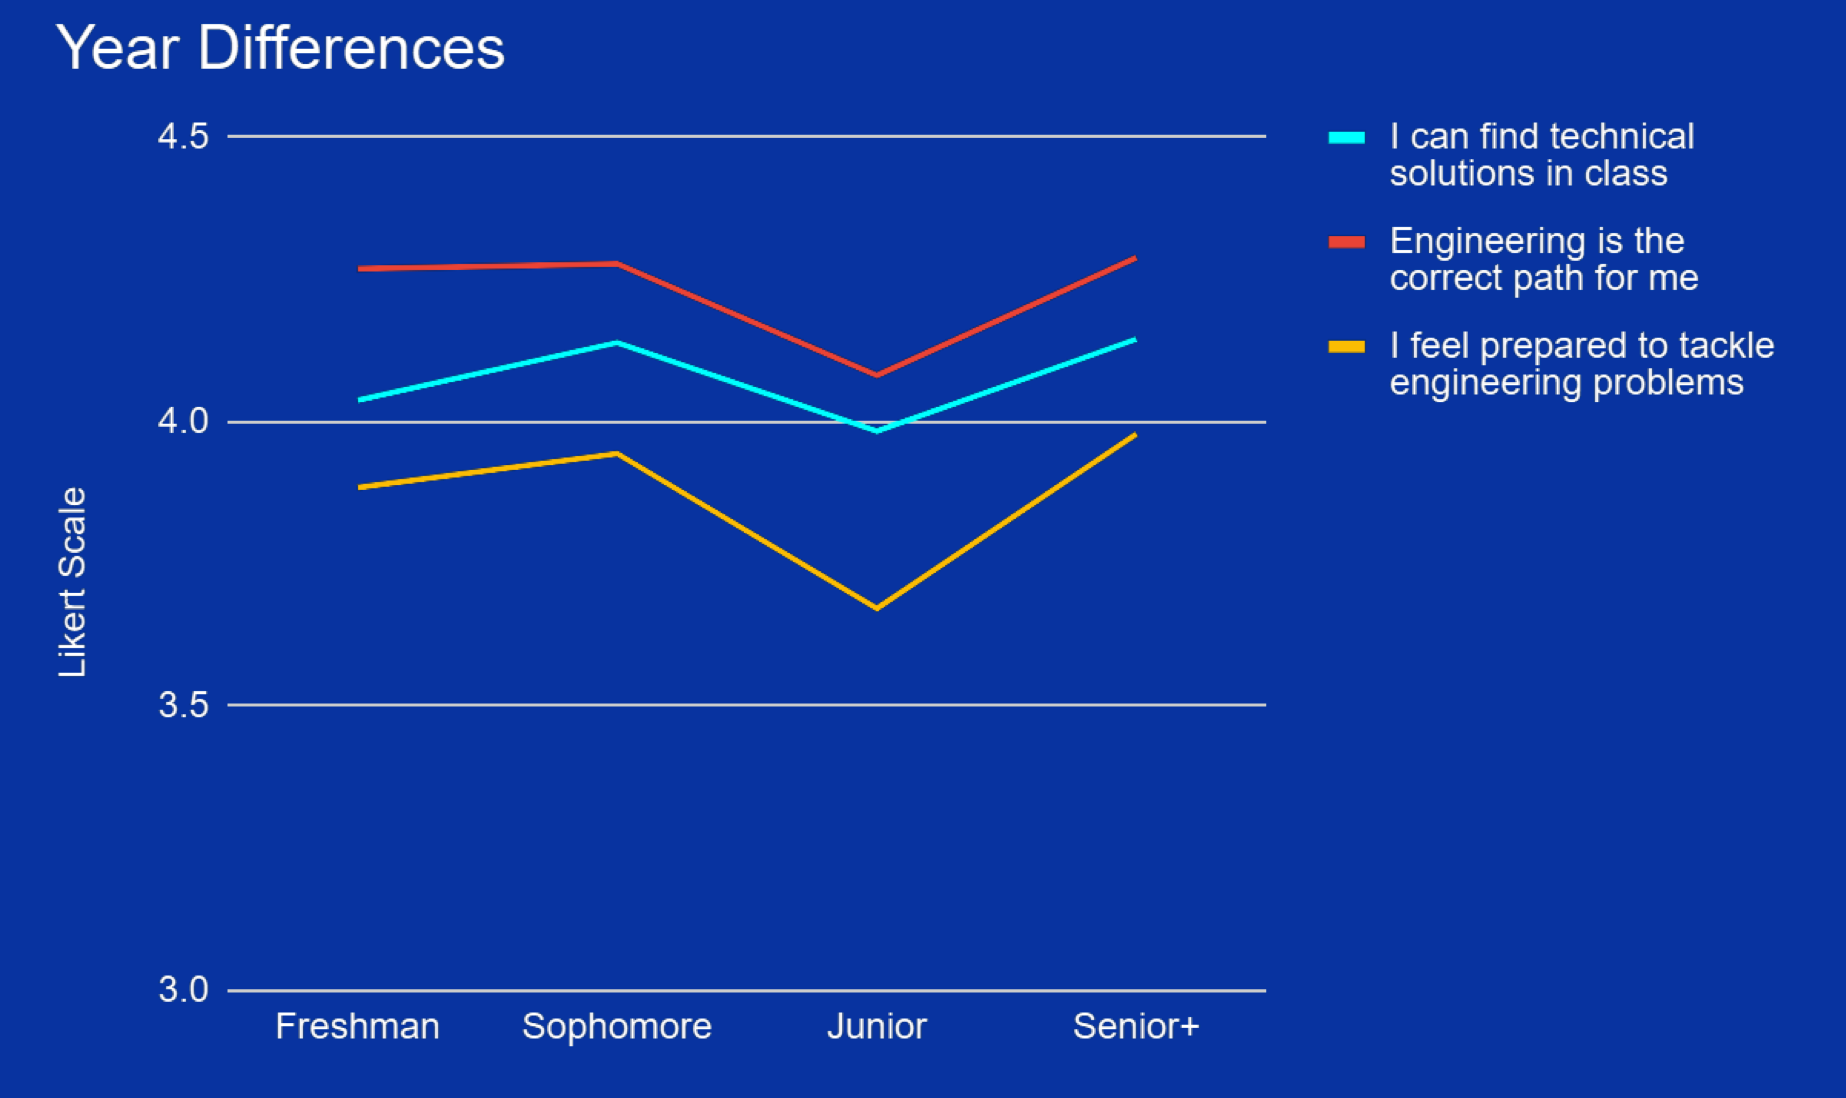
There are opportunities to improve professional identity in junior, nontraditional, and female engineers at Boise State.
Gender Differences
Year Differences
Conclusions
This data can be used to inform behaviors and strategies that support different populations of students on their road to graduation.
Our survey can also be deployed in other colleges with pertinent changes.
Additional Information
For questions or comments about this research, contact Samantha Schauer at SamanthaSchauer@u.boisestate.edu.