Jared Seale, Mark Skinner, Maranda Cantrell, Crystal Paulus, Dr. Owen M. McDougal
 Introduction
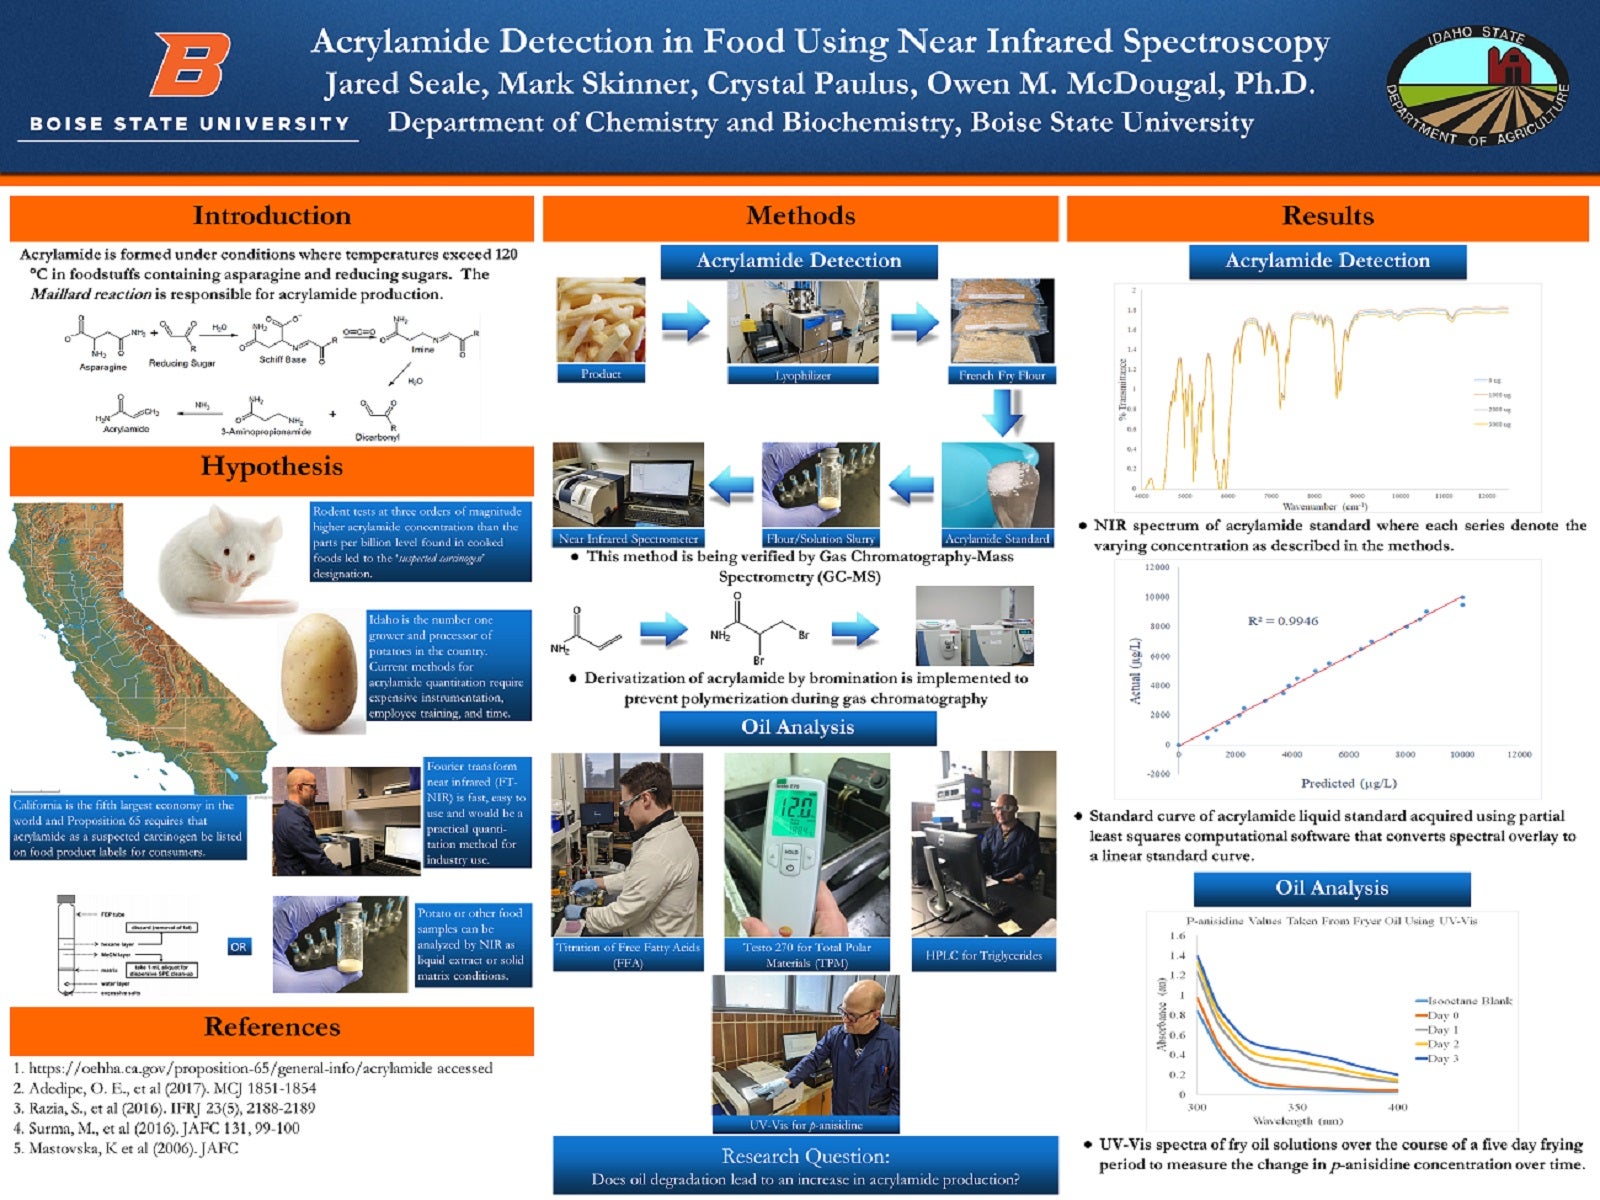
Acrylamide is formed under conditions where temperatures exceed 120 °C in foodstuffs containing asparagine and reducing sugars. The Maillard reaction is responsible for acrylamide production.
Hypothesis
- Rodent tests at three orders of magnitude higher acrylamide concentration than the parts per billion level found in cooked foods led to the ‘suspected carcinogen’ designation.
- Idaho is the number one grower and processor of potatoes in the country. Current methods for acrylamide quantitation require expensive instrumentation, employee training, and time.
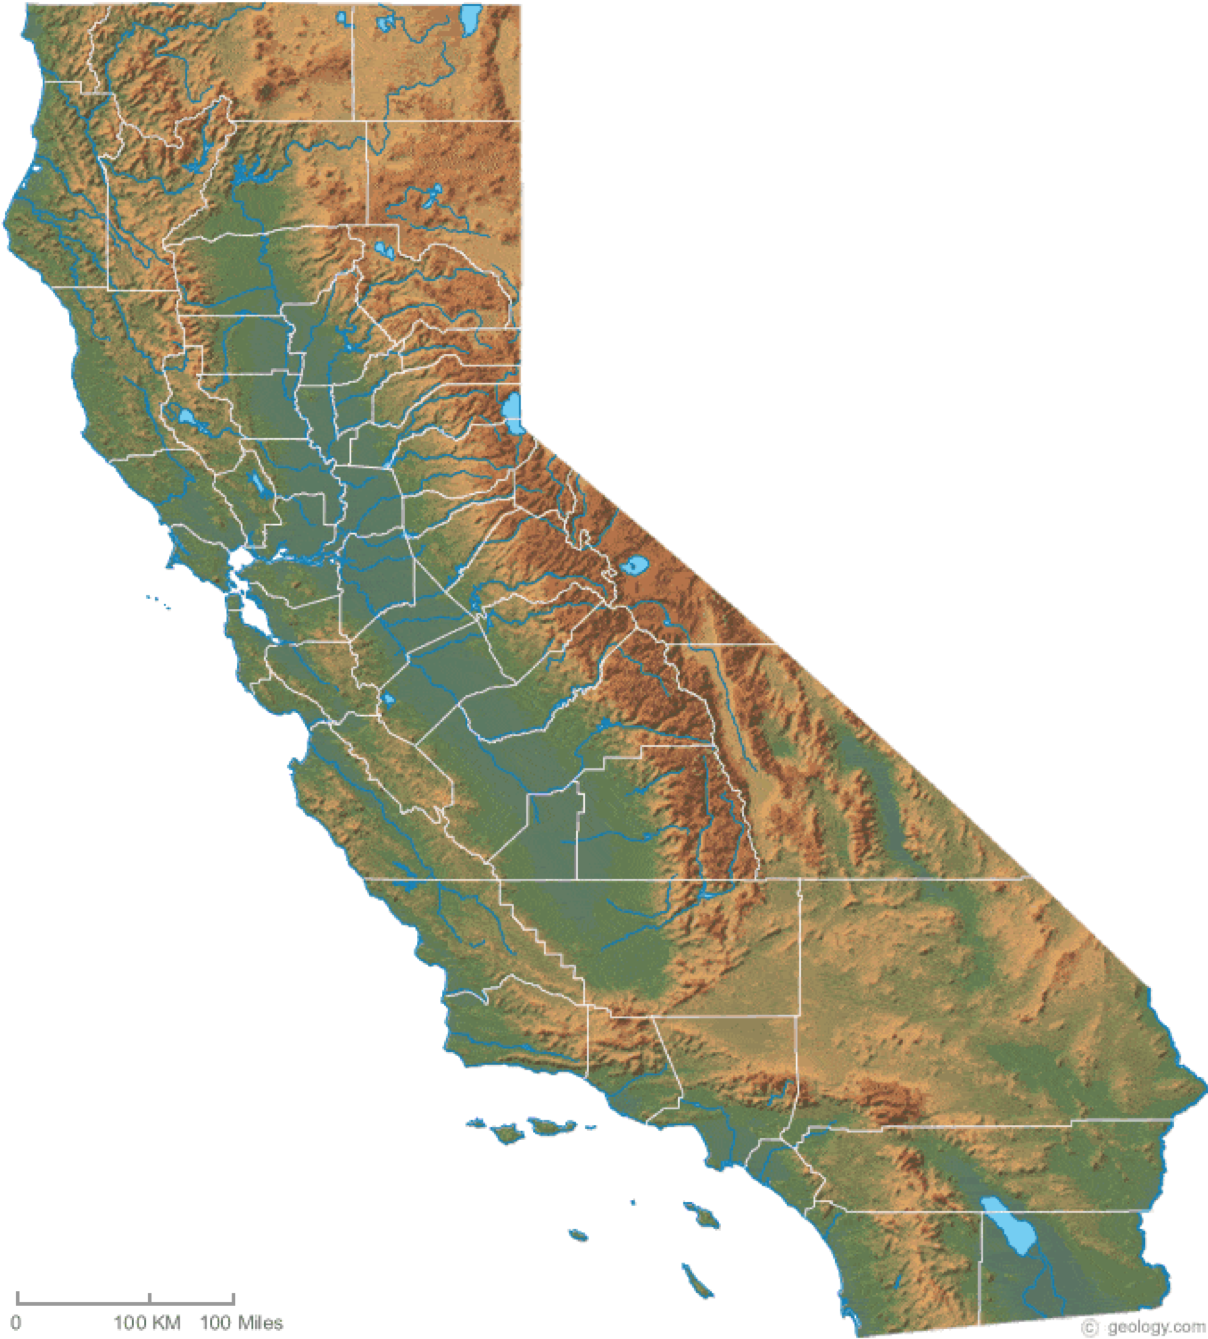
- California is the fifth largest economy in the world and Proposition 65 requires that acrylamide as a suspected carcinogen be listed on food product labels for consumers.
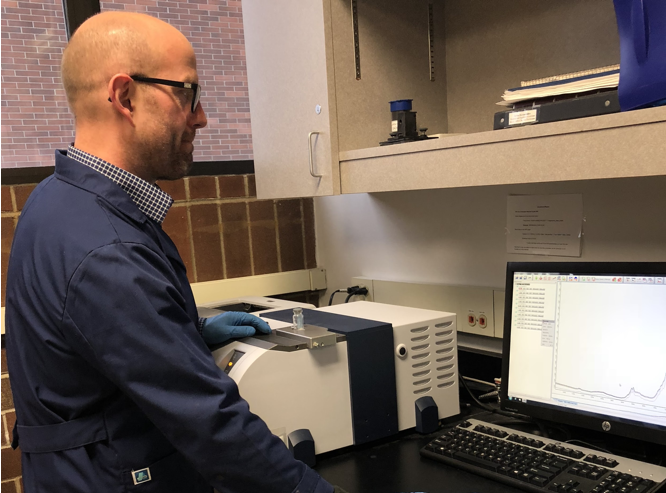
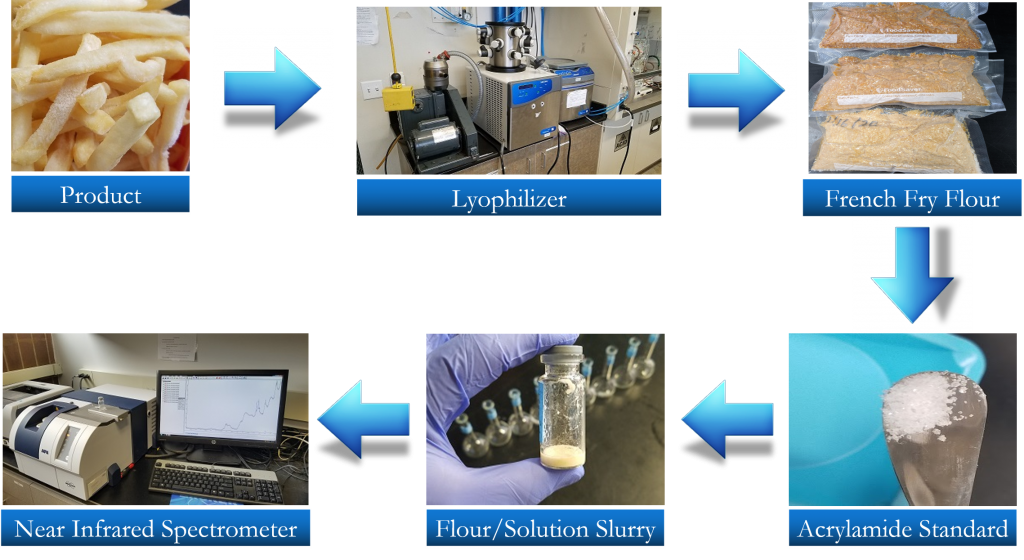
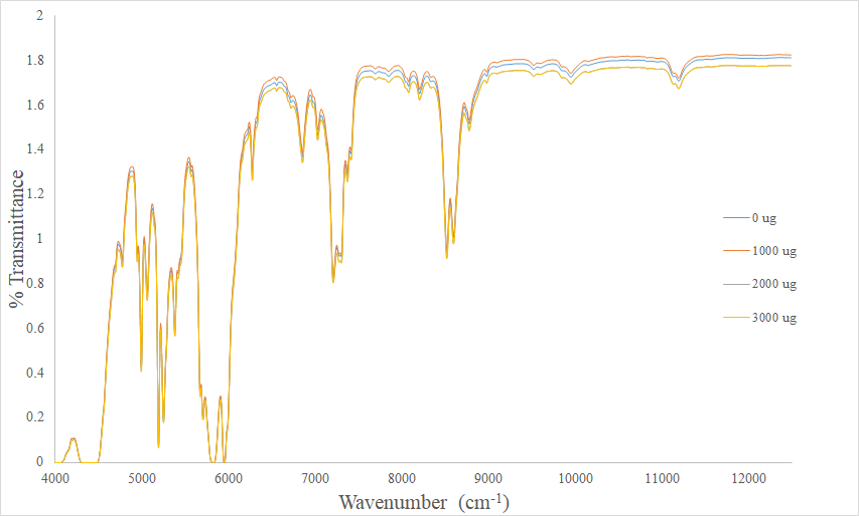
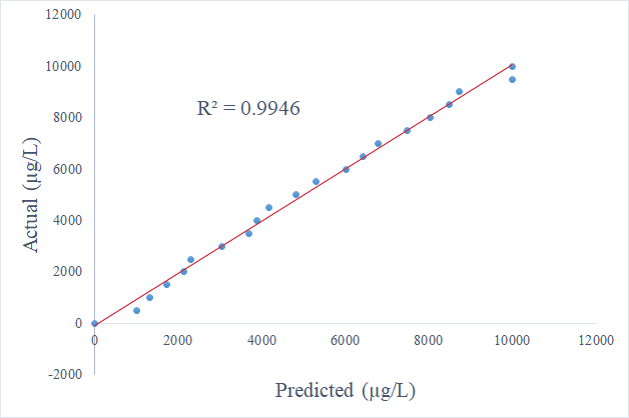
- Fourier transform near infrared (FT-NIR) is fast, easy to use and would be a practical quanti-tation method for industry use.
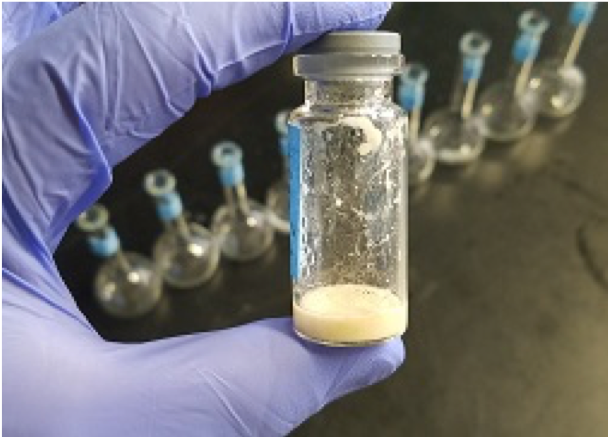
- Potato or other food samples can be analyzed by NIR as liquid extract or solid matrix conditions.
Methods
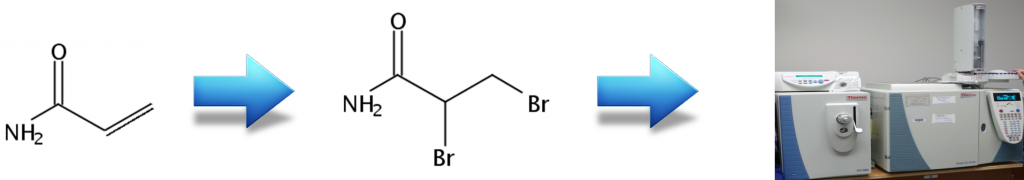
Acrylamide
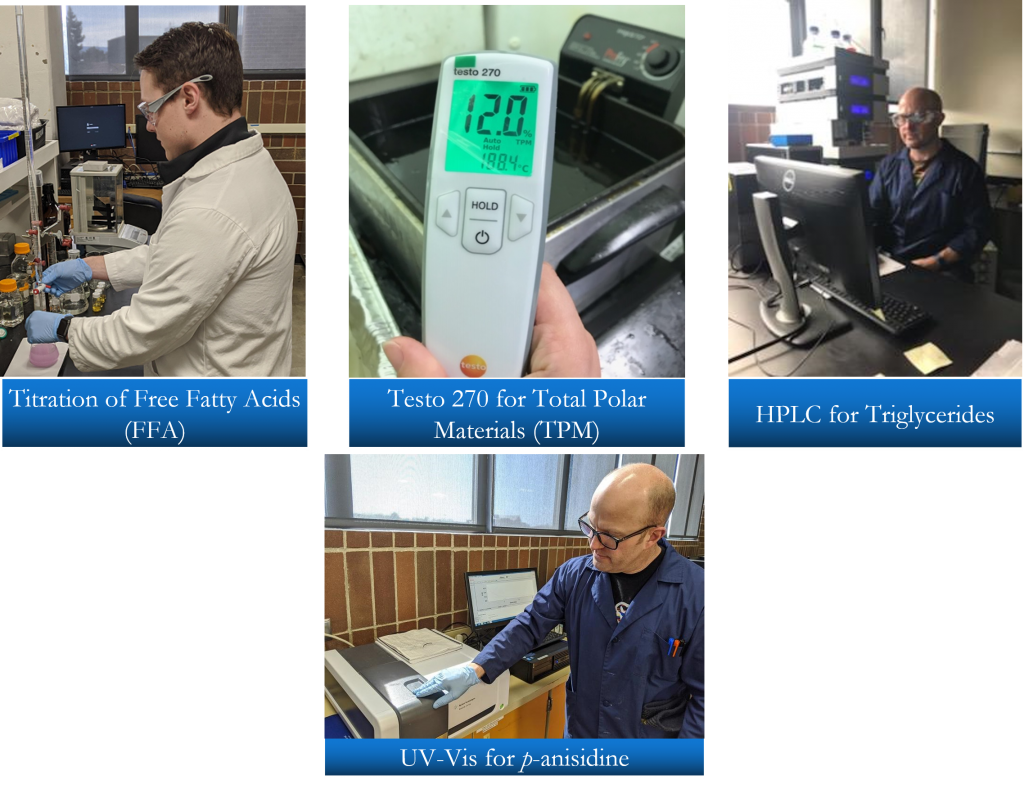
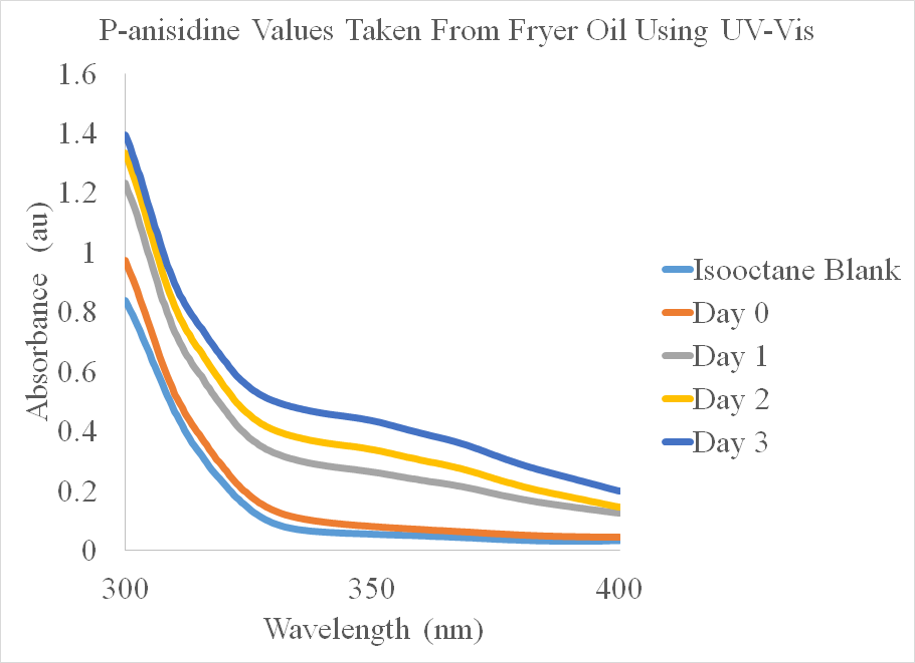
Oil Analysis
Research Question
Does oil degradation lead to an increase in acrylamide production?
Results
Acrylamide Detection
Oil Analysis
References
- https://oehha.ca.gov/proposition-65/general-info/acrylamide accessed
- Adedipe, O. E., et al (2017). MCJ 1851-1854
- Razia, S., et al (2016). IFRJ 23(5), 2188-2189
- Surma, M., et al (2016). JAFC 131, 99-100
- Mastovska, K et al (2006). JAFC