Thea Sukianto, Dr. Joe Champion, Dr. Sergio Arispe, Dr. Dylan Mikesell
Overview
Scientists studying animal behavior have begun using low-cost geolocation (GPS) trackers, but struggle to migrate large raw data files (100,000+ observations) using spreadsheet software. Animaltracker is a new R package to automate data cleaning and visualization of GPS logs. The package bundles R Shiny web applications with data processing functions to provide customizable data processing, interactive plots of animal locations over time, and statistical tools for augmenting, analyzing, and exporting the cleaned data.
Data Processing
The data workflow is summarized in a simple 4-step process:
1. Data Upload
- Upload archive of raw GPS data (.csv format)
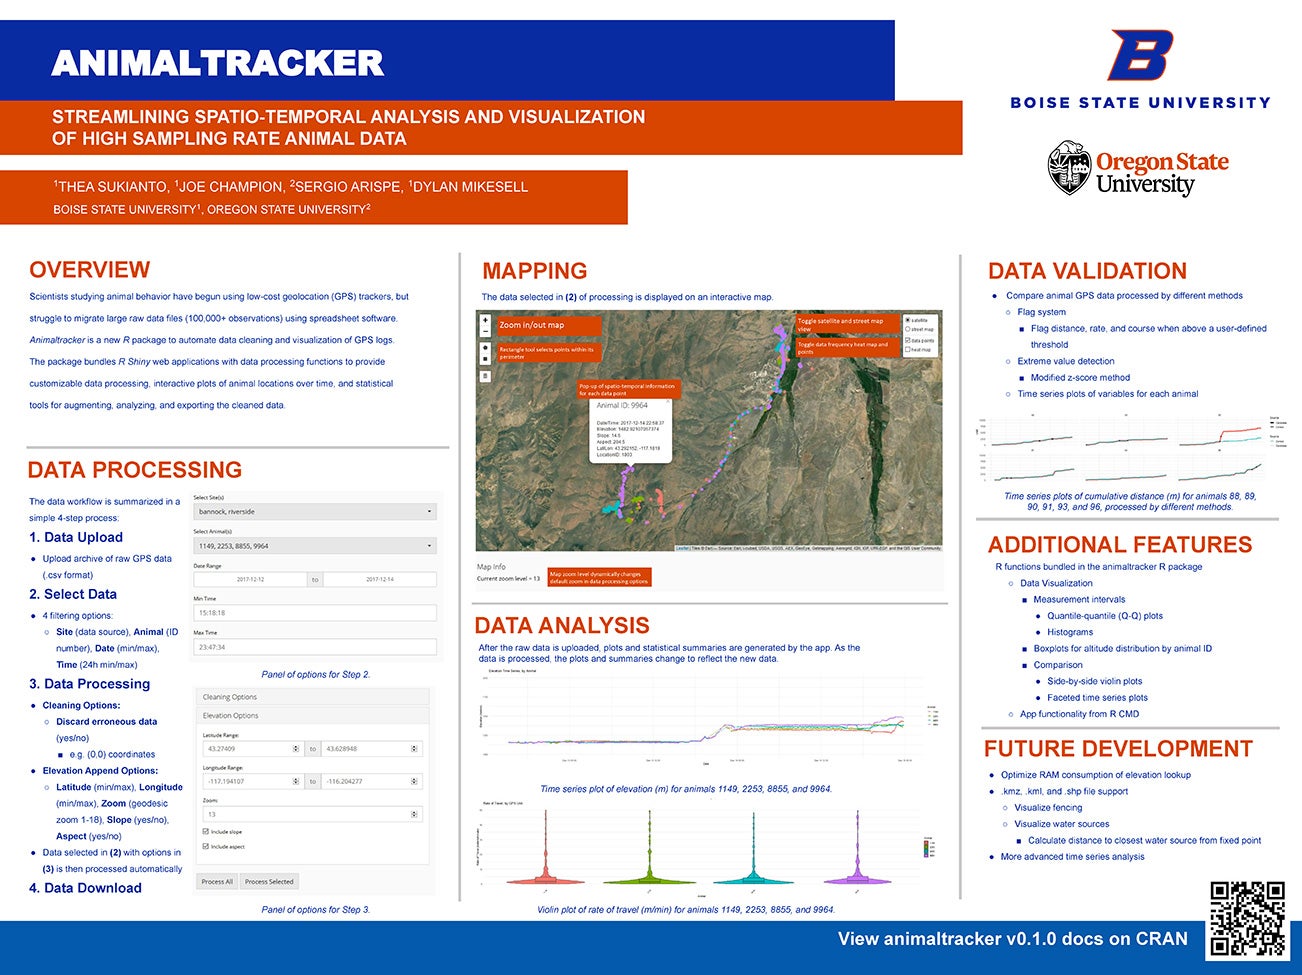
2. Select Data
4 filtering options:
- Site (data source), Animal (ID number), Date (min/max), Time (24h min/max)
Panel of options for Step 2.
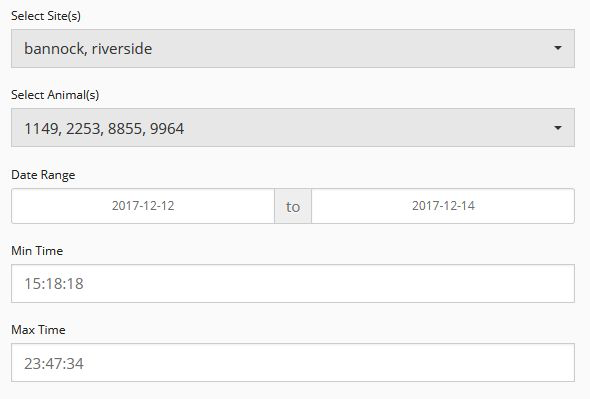
3. Data Processing
Cleaning Options:
- Discard erroneous data (yes/no)
- e.g. (0,0) coordinates
Elevation Append Options:
- Latitude (min/max), Longitude (min/max), Zoom (geodesic zoom 1-18), Slope (yes/no), Aspect (yes/no)
Data selected in (2) with options in (3) is then processed automatically
4. Data Download
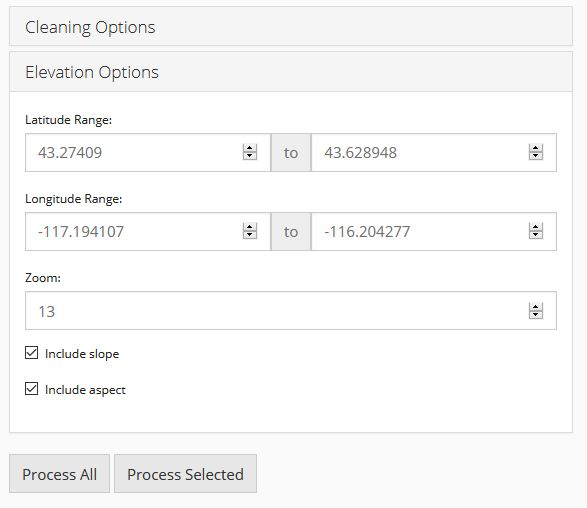
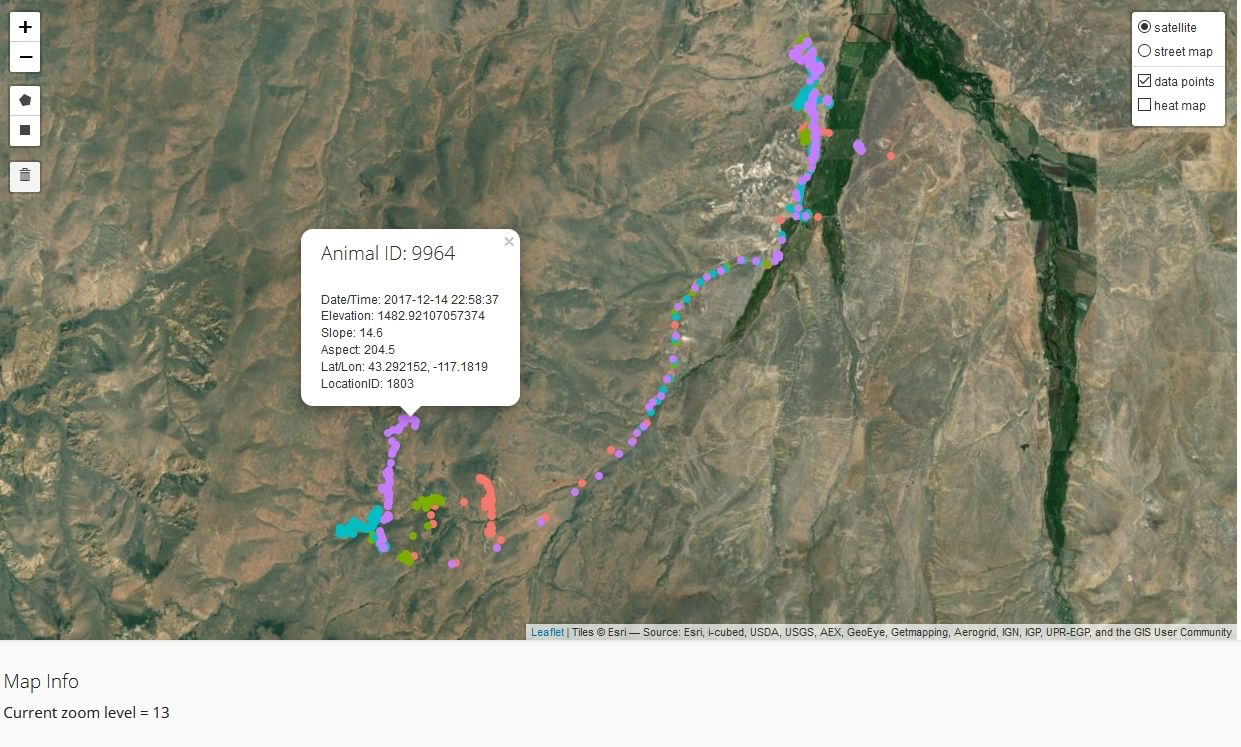
Mapping
The data selected in (2) of processing is displayed on an interactive map.
Data Analysis
After the raw data is uploaded, plots and statistical summaries are generated by the app. As the data is processed, the plots and summaries change to reflect the new data.
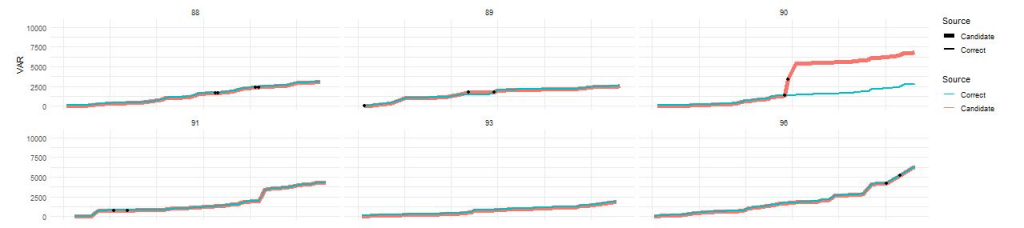
Data Validation
Compare animal GPS data processed by different methods
Flag System
- Flag distance, rate, and course when above a user-defined threshold
Extreme value detection
- Modified z-score method
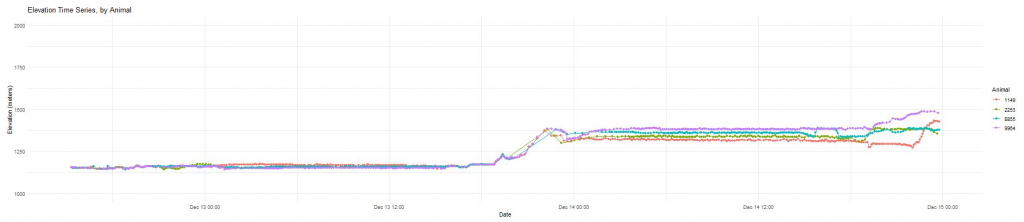
Time series plots of variables for each animal
Additional Features
R functions bundled in the animaltracker R package
- Data Visualization
- Measurement intervals
- Quantile-quantile (Q-Q) plots
- Histograms
- Boxplots for altitude distribution by animal ID
- Comparison
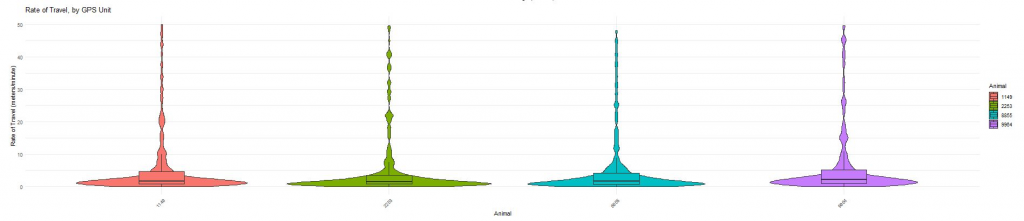
- Side-by-side violin plots
- Faceted time series plots
- App functionality from R CMD
- Measurement intervals
Future Development
- Optimize RAM consumption of elevation lookup
- .kmz, .kml, and .shp file support
- Visualize fencing
- Visualize water sources
- Calculate distance to closest water source from fixed point
- More advanced time series analysis
 Additional Information
For questions or comments about this research, contact Thea Sukianto at theophiliasukian@u.boisestate.edu.