Caitlyn Swanson, Dr. Jen Pierce, Erin Murray, Clayton Roehner
Introduction
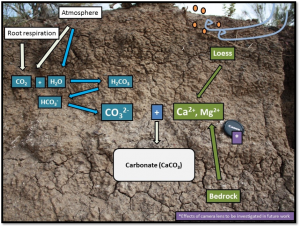
Soils play a large role in carbon capture and storage through soil organic carbon (formed through the decomposition of plants and organisms) and soil inorganic carbon (formed through the formation of pedogenic calcium carbonate). Soils store 40% of carbon as inorganic carbonate minerals, such as calcium carbonate.
This study investigates calcium concentrations of dust deposits in Reynolds Creek Experimental Watershed (RCEW) to evaluate the importance of aeolian processes for carbonate formation in soils to help characterize aeolian (windblown) processes on soils in RCEW southwest of Boise.
Reynolds Creek Study Area
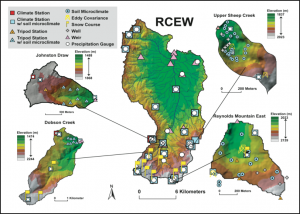
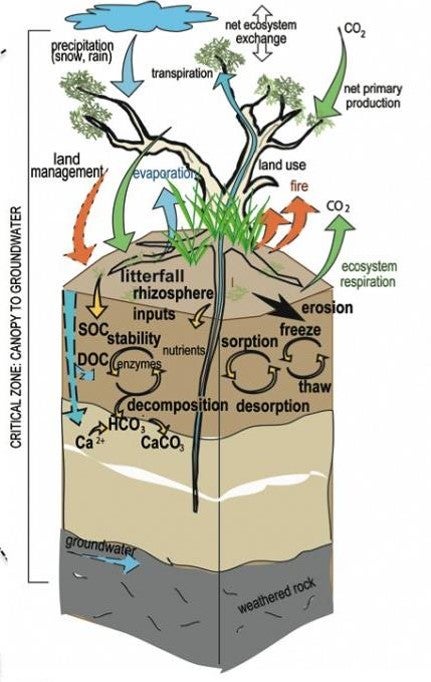
“The Reynolds Creek CZO will address the grand challenges of improving prediction of soil carbon (C) storage and flux from the pedon to landscape scale.” (criticalzone.org/Reynolds/about)
Knowing the source of the aeolian sediment and the source of calcium in RCEW dust, will help further characterize aeolian processes on soil and help researchers better understand carbon capture and storage of RCEW soils, which is necessary for carbon and climate modelling. The calcium that forms the calcium carbonates found in soils in Reynolds Creek Experimental Watershed are thought to be blown in regionally or locally through aeolian mechanisms or derived from the bedrock.
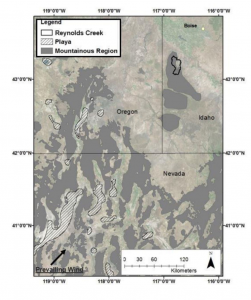
The prevailing wind direction measured at weather stations in RCEW trends from the southwest. Roehner et al. (2018) hypothesized that the source of the suspended sediment may be blown in from semi-arid sagebrush deserts, as well as, playa and alluvial fan complexes from SE Oregon, NE Nevada and NE California based on the regional wind direction. Figure 7 shows the proximity of RCEW to the hypothesized playa sources from southeast Oregon and northeast Nevada.
Methods
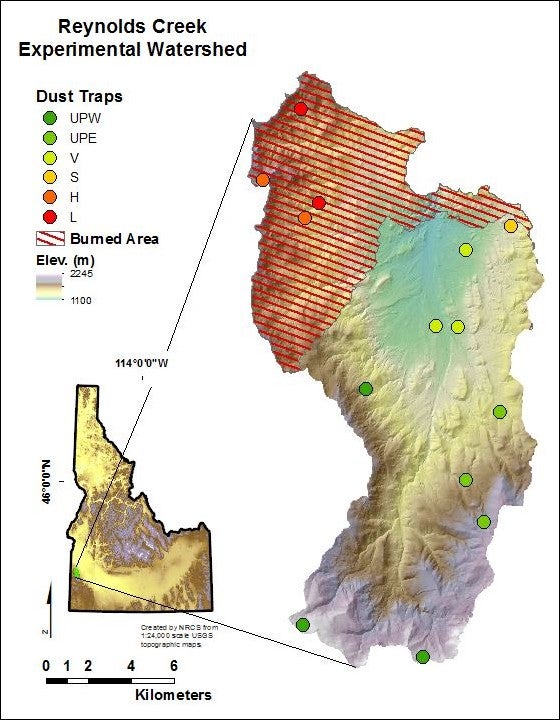
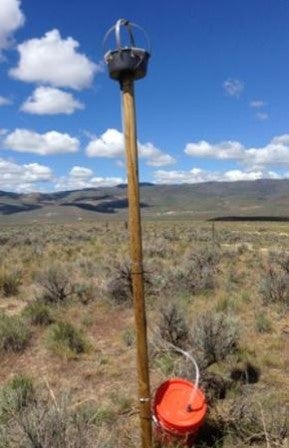
Twelve passive dust traps were dispersed at different subsets based on topography, elevation, and vegetation in Reynolds Creek Experimental watershed. These traps are situated two meters above the surface and capture the fallout of entrained material in atmospheric suspension that are vertically deposited through Teflon, onto glass marbles, in a bunt pan. The dust trap field setup is shown in Figure 4.
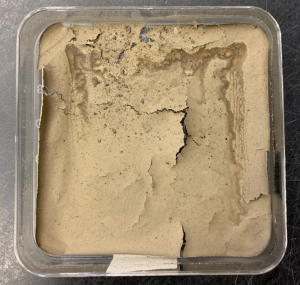
Dust sediment was deposited over a two-year period and the dustpan device from all the dust traps were collected from RCEW. The bunt pan, glass marbles, and Teflon mesh were rinsed using DI water into a Pyrex tray and placed in an oven at 60°C to dry the sample. The dried dust sample is shown in Figure 6 below.
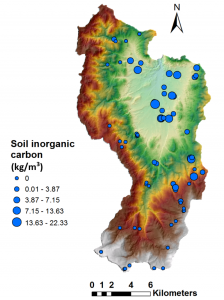
The samples were analyzed for elemental and nutrient concentrations using a Field Portable X-Ray Fluorescence (pXRF). Each dust site sample was tested in three different spots of the sample and averaged for the most accurate reading. The elemental and nutrient concentrations measured at each site were mapped proportionally to show the spatial variability of calcium from each dust trap in RCEW using ArcGIS. The circle size is proportional to the calcium concentration in parts per million (ppm) at the dust trap location shown in Figure 8.
A few analyses were in preparation that will be continued in the future. Future research will use the FLASH Nitrogen and Carbon Analyzer to run an analysis of the organic material present in the dust samples and the Malvern Mastersizer 2000 will determine the grain size distribution of the dust.
Results
The data shows no obvious connection between elevation and calcium concentrations in the dust samples. Figure 8 shows that the dust deposits with the highest concentrations of calcium are situated over a variety of local bedrock types (granitic rock, quaternary alluvium, Salmon Creek volcanics, and rhyolitic welded tuff). The lack of correlation between the underlying bedrock and dust indicates that the calcium in the dust is not sourced from local geology.
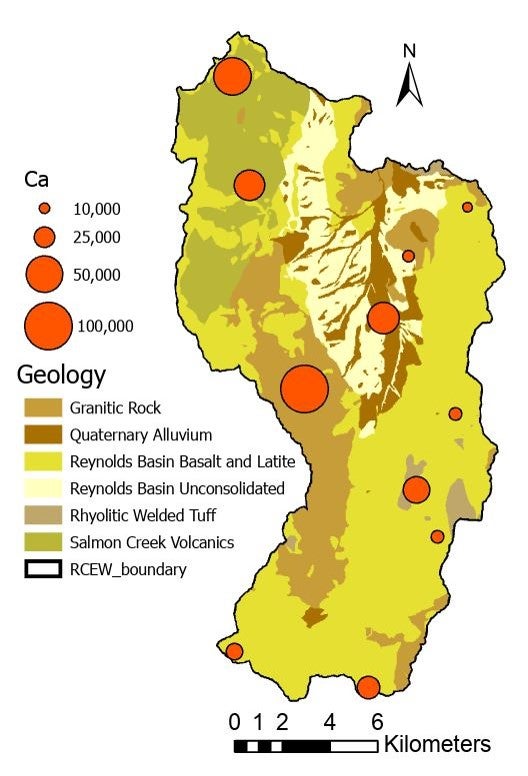
The dust site with the highest concentration of calcium is overlying granitic rocks with lower calcium concentrations, supporting the hypothesis that the exogenic dust is blown in from a regional source and contributing to RCEW soils.
Continued research will compare the geochemical signal of the dust with other regional dust and hypothesized sources. An analysis of RCEW soil calcium concentrations and inorganic soil carbonates will be compared to aeolian sediment and bedrock calcium concentrations to further understand the importance of aeolian processes on soils.
Future/Active Research
I plan to use the elemental and nutrient concentrations of the dust in comparison to the local soil and local bedrock to help understand whether the source of calcium and other important elements and nutrients associated with aeolian transport are being predominantly introduced to soils through aeolian mechanisms. I will use end member mixing calculations described in Stark (2012) to do so. I will plan to calculate the “enrichment” of the dust and compare it to that of the average upper continental crust of hypothesized sources to understand the source of the dust.
Other future research includes analyzing horizontal aeolian transport using Malvern Wilson and Cooke (MWAC) dust traps to help further characterize the importance of aeolian processes on soils in Reynolds Creek Experimental Watershed.
Sources and Acknowledgements
- ABOUT: Reynolds Critical Zone Observatory. (n.d.). Retrieved from http://criticalzone.org/reynolds/about/
- Roehner, C., Pierce, J., Yager, E., “Wildfire and Earth Surface Processes: Postfire Variation in Aeolian Deposition in the Northern Great Basin” in review for Earth Surface Processes and Landforms.
- Roehner, Clayton, MS Thesis, Boise State University, 2019, Magnitude and Character of Post Fire Aeolian Deposition in the Northern Great Basin.
- Stanbery, Christopher, MS Thesis, Boise State University, 2016, Controls on the Presence and Concentrations of Soil Inorganic Carbon in a Transitional Semi-Arid Watershed.
- Stanbery, C., Pierce, J., Benner, S., Lohse, K., 2017, On the rocks: Quantifying storage of inorganic soil carbon on gravels and determining pedon-scale variability. Catena 157 (2017): 436-442.
I acknowledge Boise State University advising and facilities, and USDA ARS for cooperative research.
Additional Information
For questions or comments about this research, contact Caitlyn Swanson at caitlynswanson@u.boisestate.edu.