Riley C. Winters, Cayden Doyle, Adrianna E. Lupercio, Dr. T. Nelson, Dr. Brian J. Jaques
I. Background
Motivation for Research
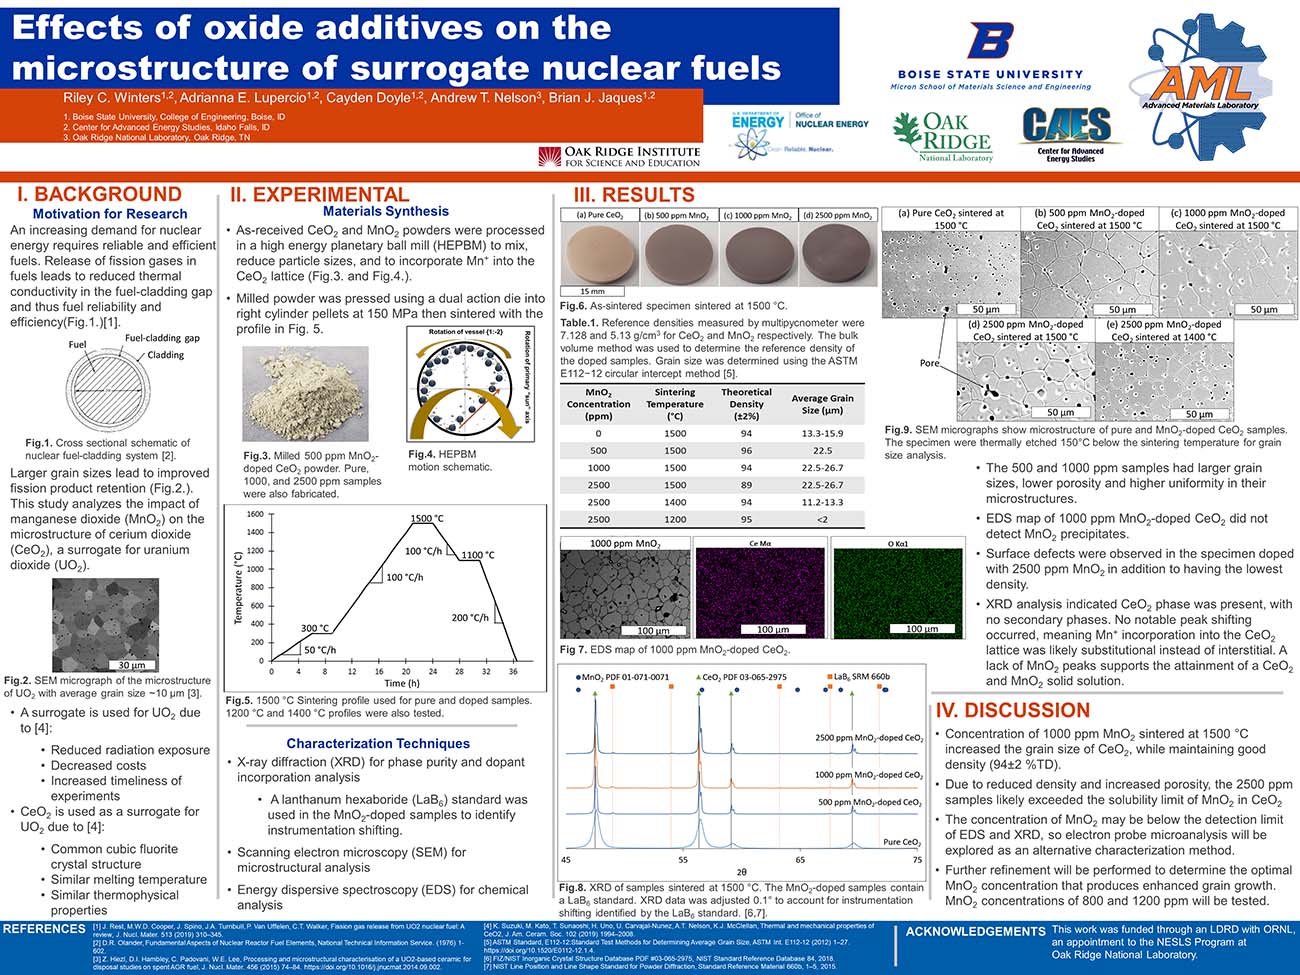
An increasing demand for nuclear energy requires reliable and efficient fuels. Release of fission gases in fuels leads to reduced thermal conductivity in the fuel-cladding gap and thus fuel reliability and efficiency(Fig.1.)[1].
- A surrogate is used for UO2 due to [4]:
- Reduced radiation exposure
- Decreased costs
- Increased timeliness of experiments
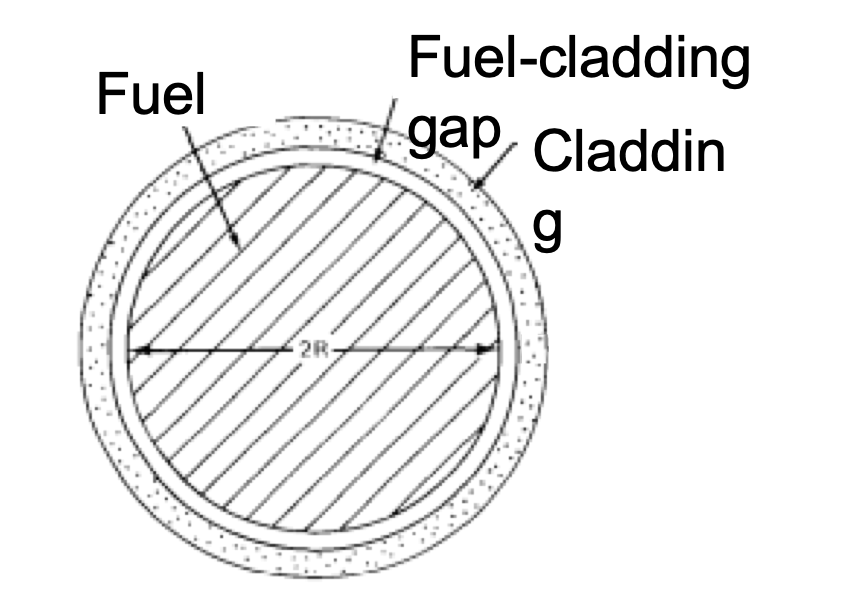
- CeO2 is used as a surrogate for UO2 due to [4]:
- Common cubic fluorite crystal structure
- Similar melting temperature
- Similar thermophysical properties
II. Experimental
Material Synthesis
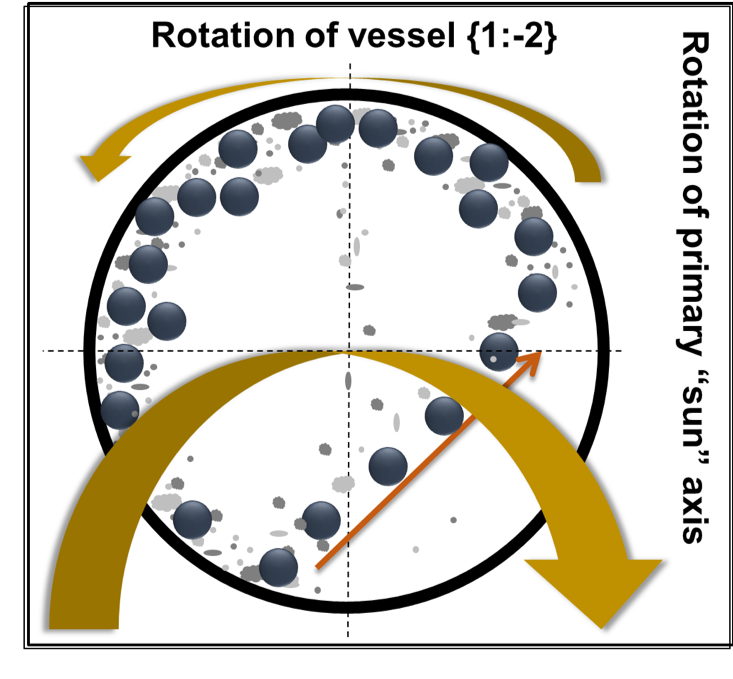
- As-received CeO2 and MnO2 powders were processed in a high energy planetary ball mill (HEPBM) to mix, reduce particle sizes, and to incorporate Mn+ into the CeO2 lattice (Fig.3. and Fig.4.).
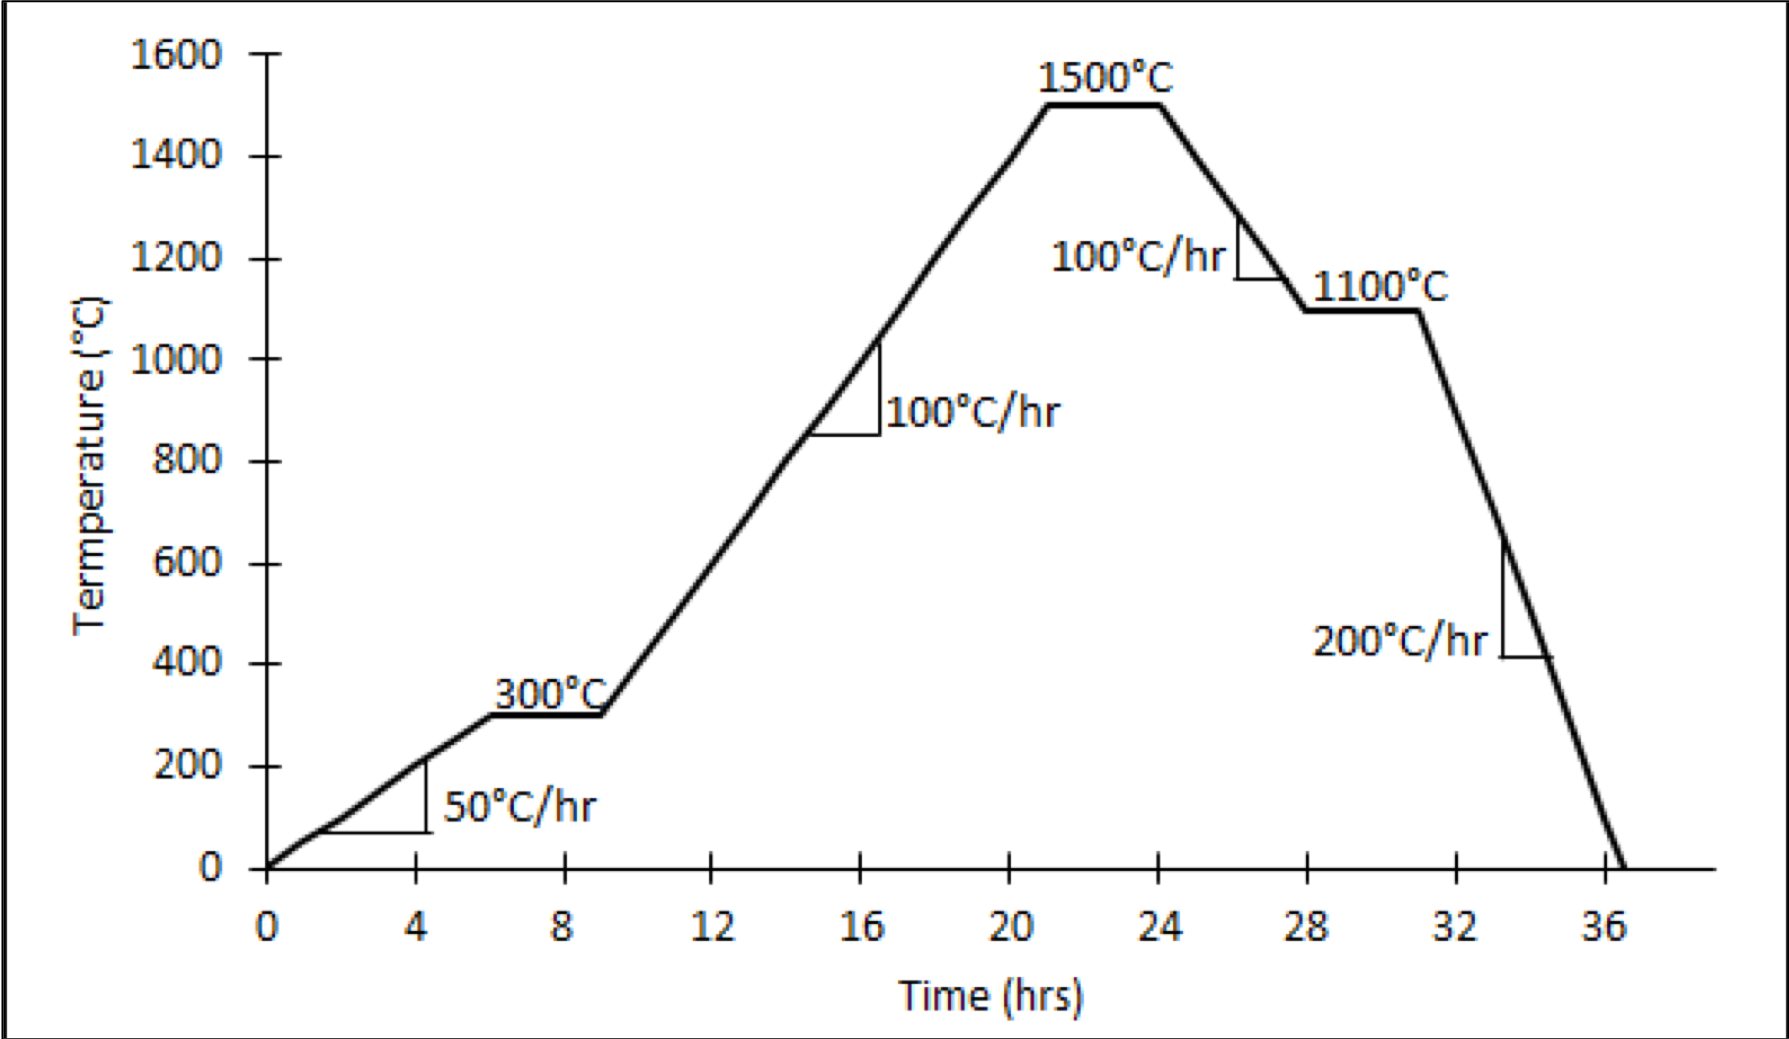
- Milled powder was pressed using a dual action die into right cylinder pellets at 150 MPa then sintered with the profile in Fig. 5.
Characterization Techniques
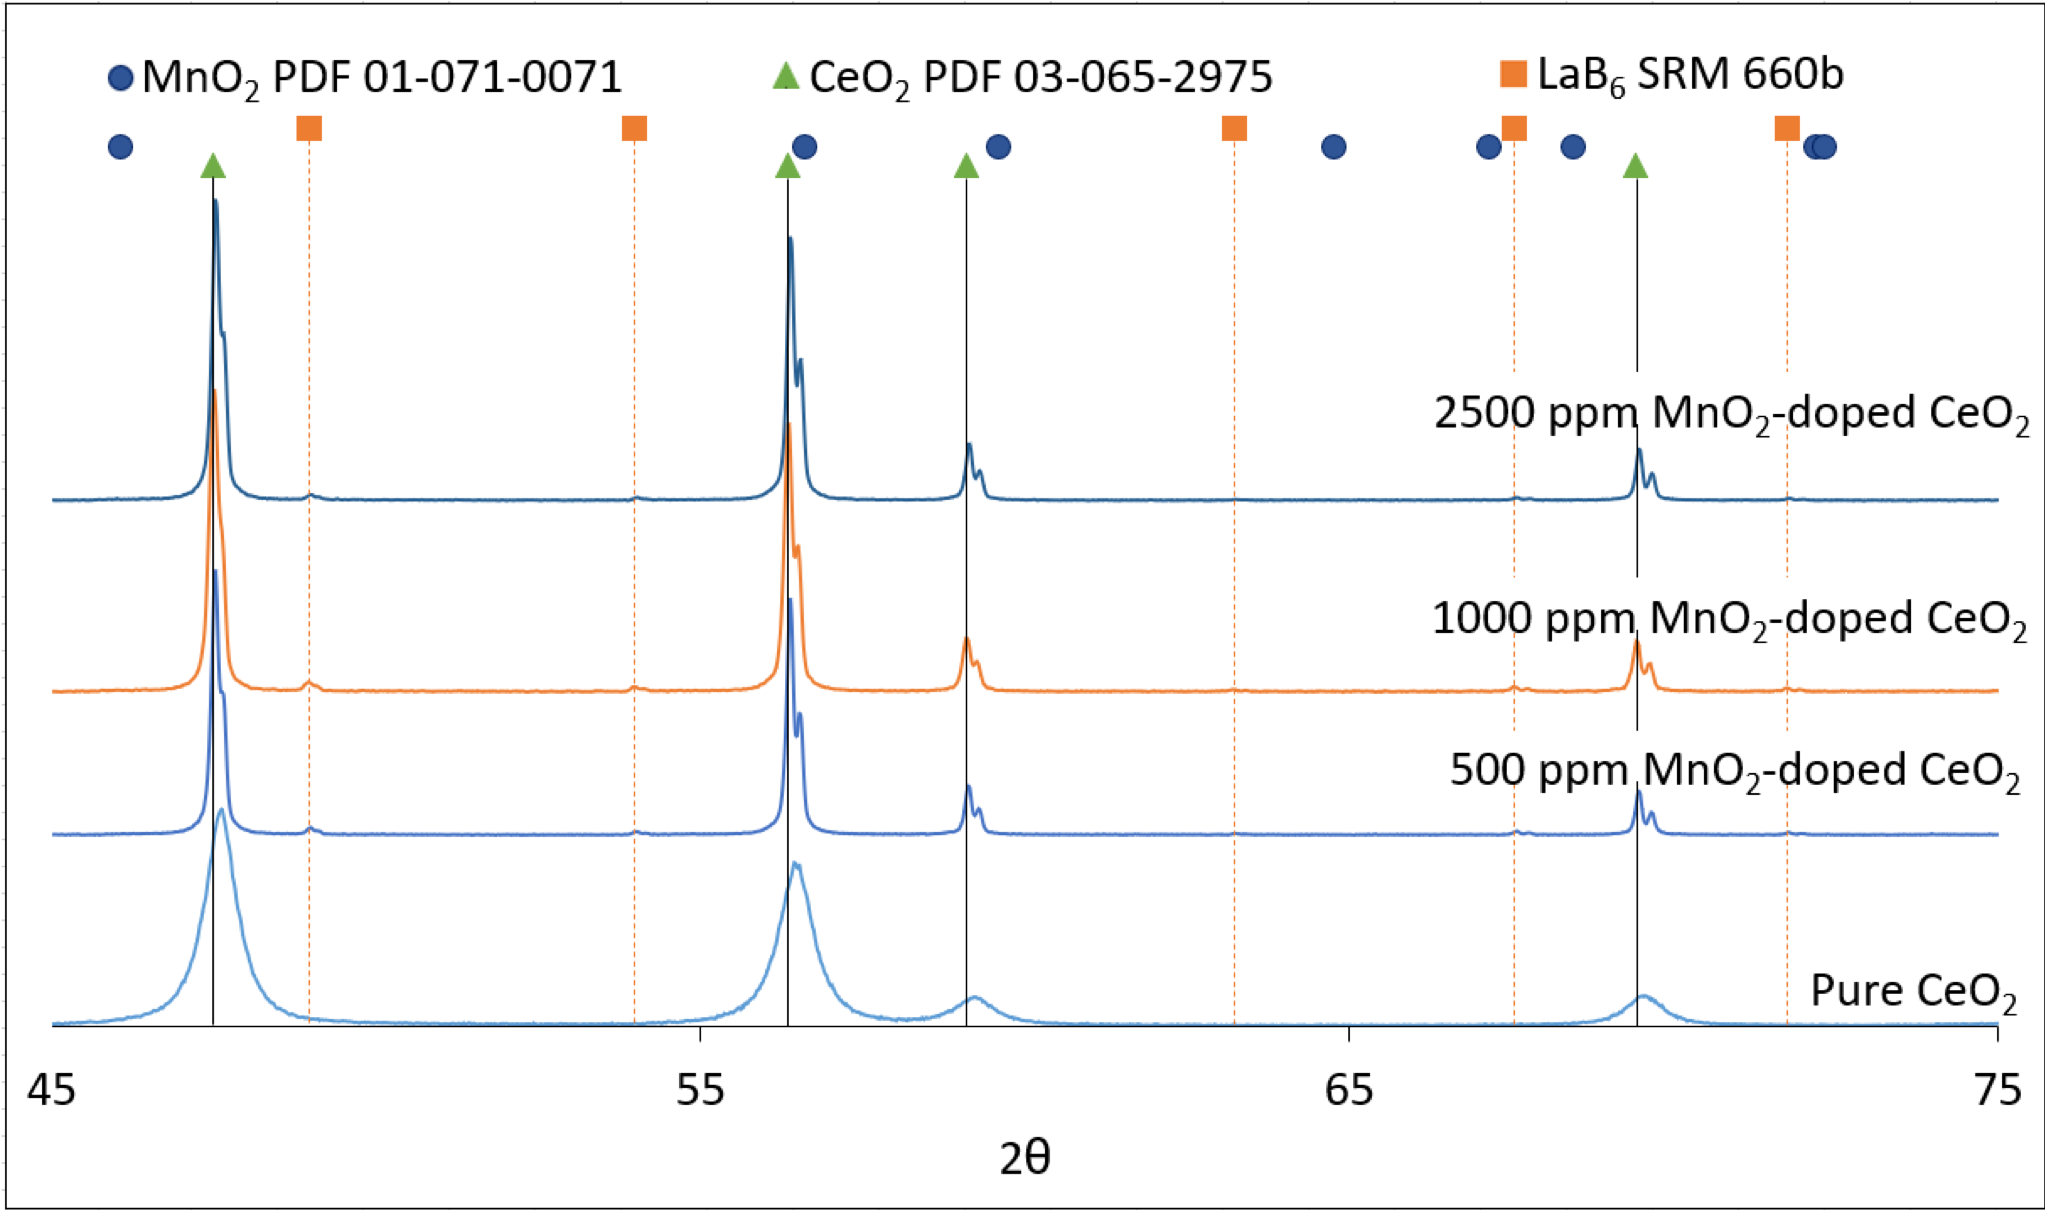
- X-ray diffraction (XRD) for phase purity and dopant incorporation analysis
- A lanthanum hexaboride (LaB6) standard was used in the MnO2-doped samples to identify instrumentation shifting.
- Scanning electron microscopy (SEM) for microstructural analysis
- Energy dispersive spectroscopy (EDS) for chemical analysis
III. Results
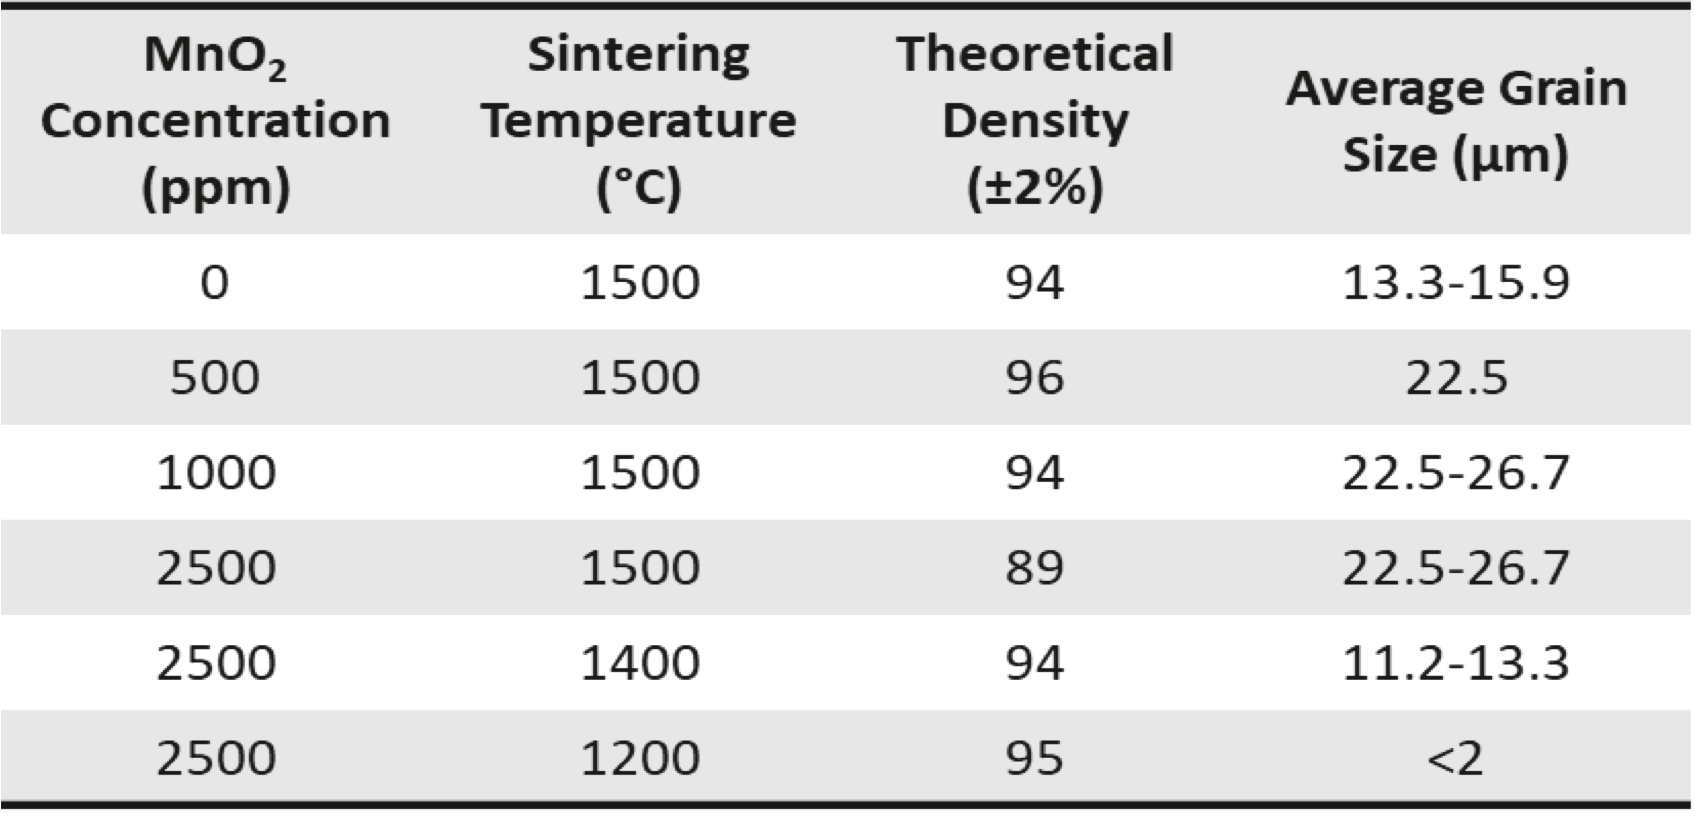
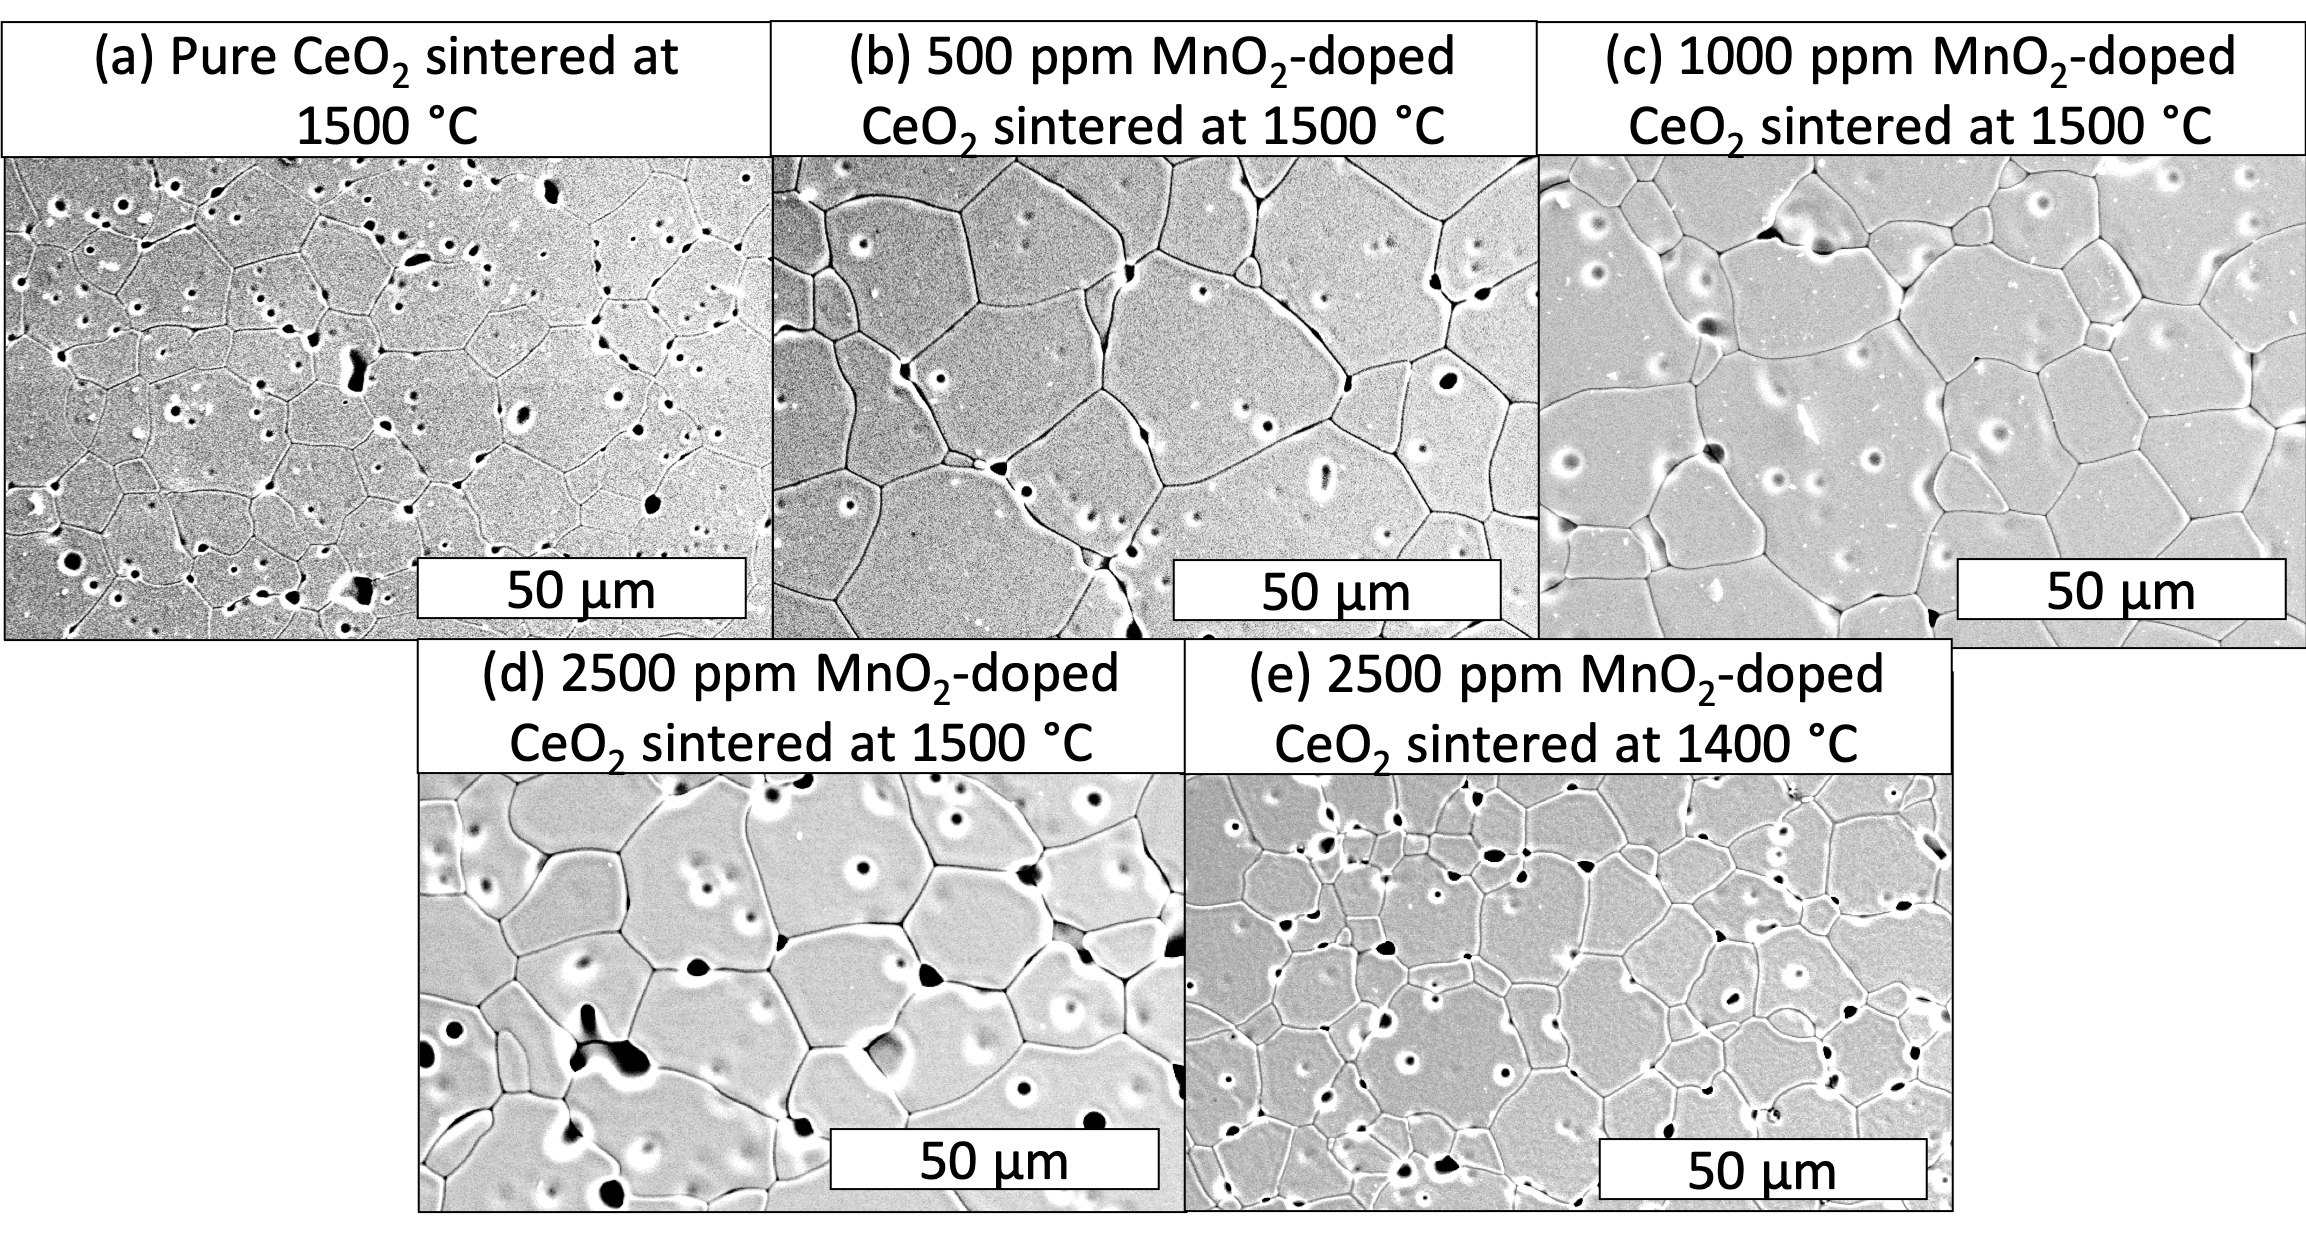
- The 500 and 1000 ppm samples had larger grain sizes, lower porosity and higher uniformity in their microstructures.
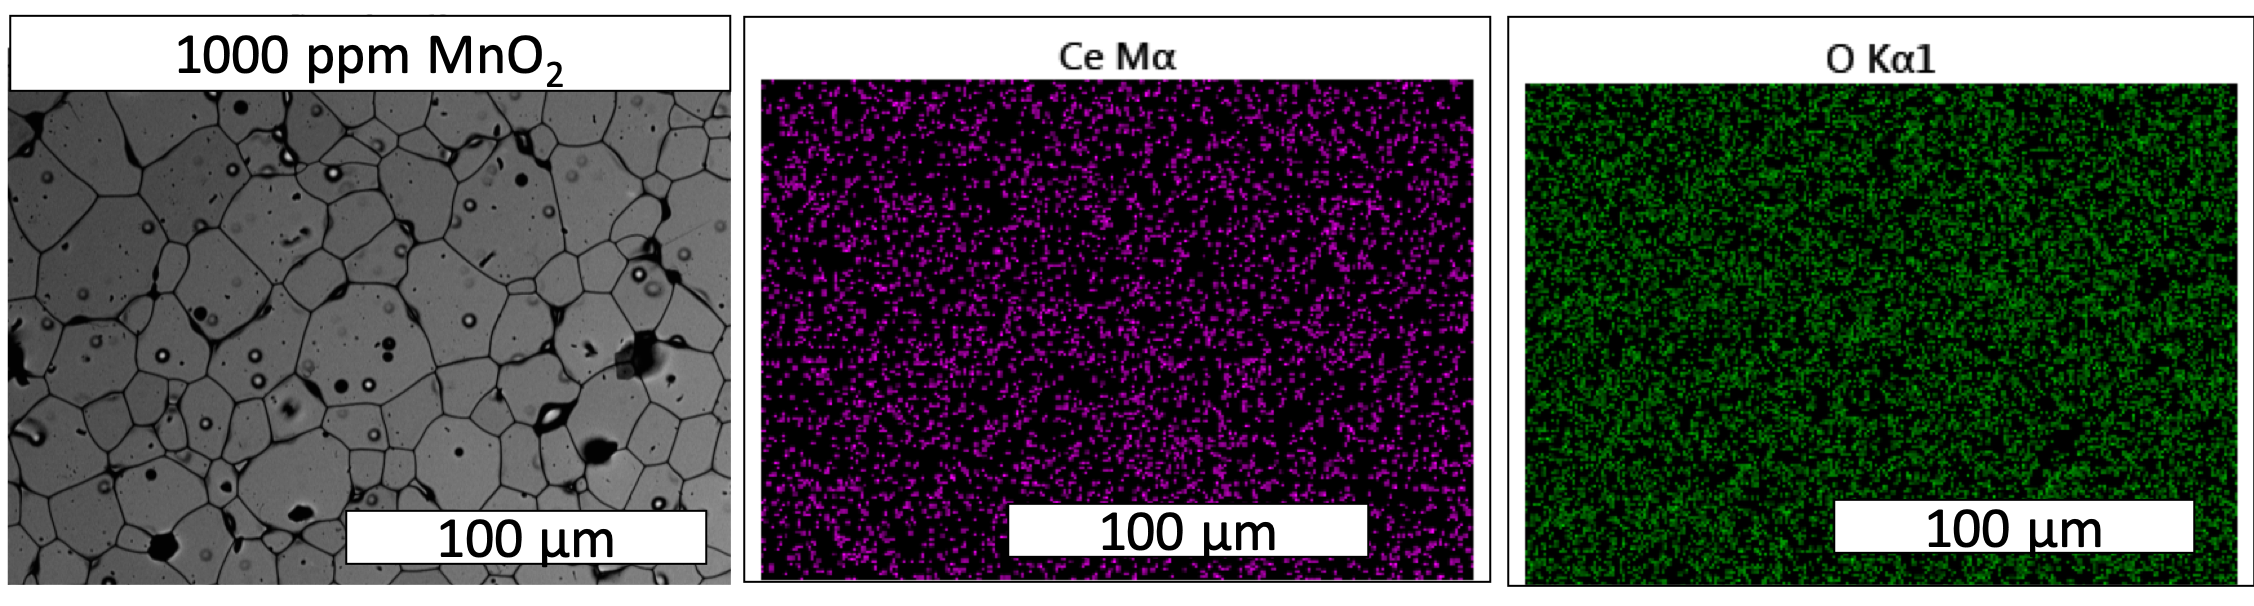
- EDS map of 1000 ppm MnO2-doped CeO2 did not detect MnO2 precipitates.
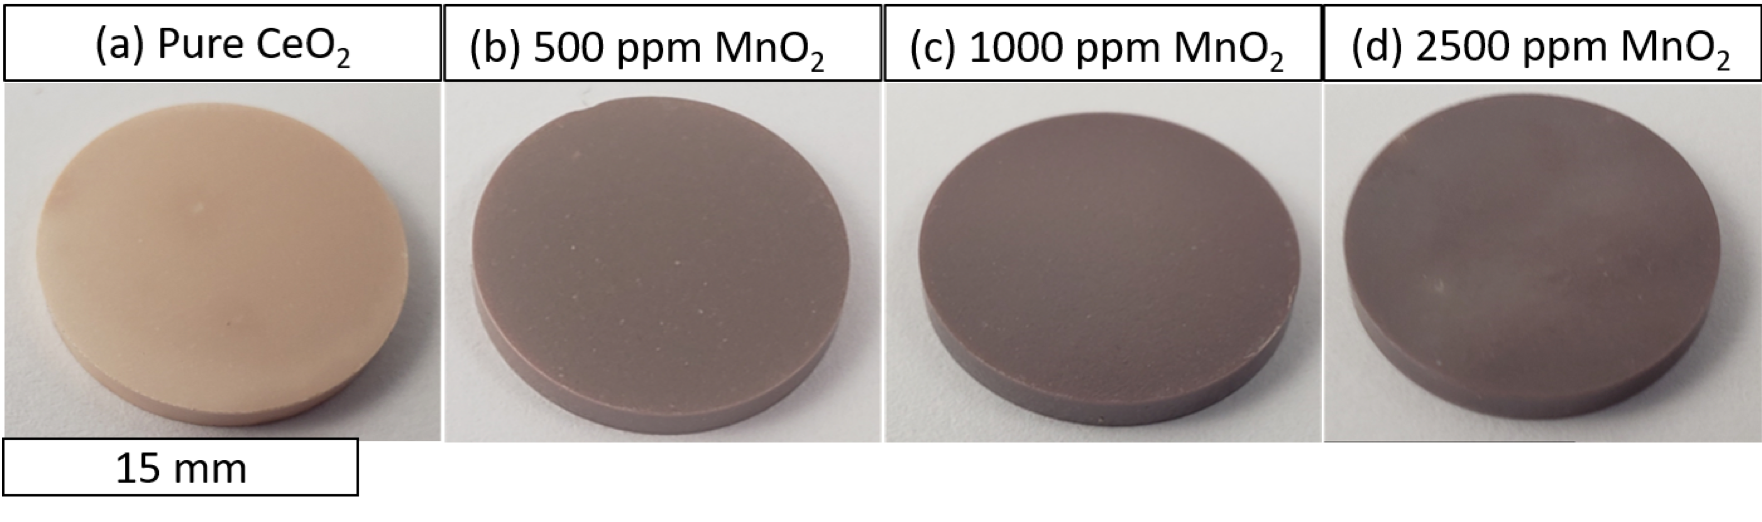
- Surface defects were observed in the specimen doped with 2500 ppm MnO2 in addition to having the lowest density.
- XRD analysis indicated CeO2 phase was present, with no secondary phases. No notable peak shifting occurred, meaning Mn+ incorporation into the CeO2 lattice was likely substitutional instead of interstitial. A lack of MnO2 peaks supports the attainment of a CeO2 and MnO2 solid solution.
IV. Discussion
- Concentration of 1000 ppm MnO2 sintered at 1500 °C increased the grain size of CeO2, while maintaining good density (94±2 %TD).
- Due to reduced density and increased porosity, the 2500 ppm samples likely exceeded the solubility limit of MnO2 in CeO2.
- The concentration of MnO2 may be below the detection limit of EDS and XRD, so electron probe microanalysis will be explored as an alternative characterization method.
- Further refinement will be performed to determine the optimal MnO2 concentration that produces enhanced grain growth. MnO2 concentrations of 800 and 1200 ppm will be tested.
Acknowledgements
This work was funded through an LDRD with ORNL, an appointment to the NESLS Program at Oak Ridge National Laboratory.
Riley C. Winters1,2, Adrianna E. Lupercio1,2, Cayden Doyle1,2, Andrew T. Nelson3, Brian J. Jaques1,2
- Boise State University, College of Engineering, Boise, ID
- Center for Advanced Energy Studies, Idaho Falls, ID
- Oak Ridge National Laboratory, Oak Ridge, TN
References
- [1] J. Rest, M.W.D. Cooper, J. Spino, J.A. Turnbull, P. Van Uffelen, C.T. Walker, Fission gas release from UO2 nuclear fuel: A review, J. Nucl. Mater. 513 (2019) 310–345.
- [2] D.R. Olander, Fundamental Aspects of Nuclear Reactor Fuel Elements, National Technical Information Service. (1976) 1-602.
- [3] Z. Hiezl, D.I. Hambley, C. Padovani, W.E. Lee, Processing and microstructural characterisation of a UO2-based ceramic for disposal studies on spent AGR fuel, J. Nucl. Mater. 456 (2015) 74–84. https://doi.org/10.1016/j.jnucmat.2014.09.002.
- [4] K. Suzuki, M. Kato, T. Sunaoshi, H. Uno, U. Carvajal-Nunez, A.T. Nelson, K.J. McClellan, Thermal and mechanical properties of CeO2, J. Am. Ceram. Soc. 102 (2019) 1994–2008.
- [5] ASTM Standard, E112-12:Standard Test Methods for Determining Average Grain Size, ASTM Int. E112-12 (2012) 1–27. https://doi.org/10.1520/E0112-12.1.4.
- [6] FIZ/NIST Inorganic Crystal Structure Database PDF #03-065-2975, NIST Standard Reference Database 84, 2018.
- [7] NIST Line Position and Line Shape Standard for Powder Diffraction, Standard Reference Material 660b, 1–5, 2015.
Additional Information
For questions or comments about this research, please contact Riley Winters at rileywinters@u.boisestate.edu