
24. Increasing Citizen Participation: A Toolkit for the City of Boise to Engage Young Adults

Michael Byrd, Doug Exton, Seth Hayes-Fugal, Ryan Hurlburt, Dr. Jillian Moroney, Ashley Orme Nichols, Hanna Veal, Katie Wright

Byrd final poster - view content on posts page
Select to view full poster image

Survey Results

Paying for Housing

bar chart - paying for housing
How do you usually pay for housing? 34 Student loans, 53 Student jobs, 51 Scholarships / Grants, 2 Paid internships, 20 Multiple jobs, 8 GI Bill / Military Benefits, 102 Family Support
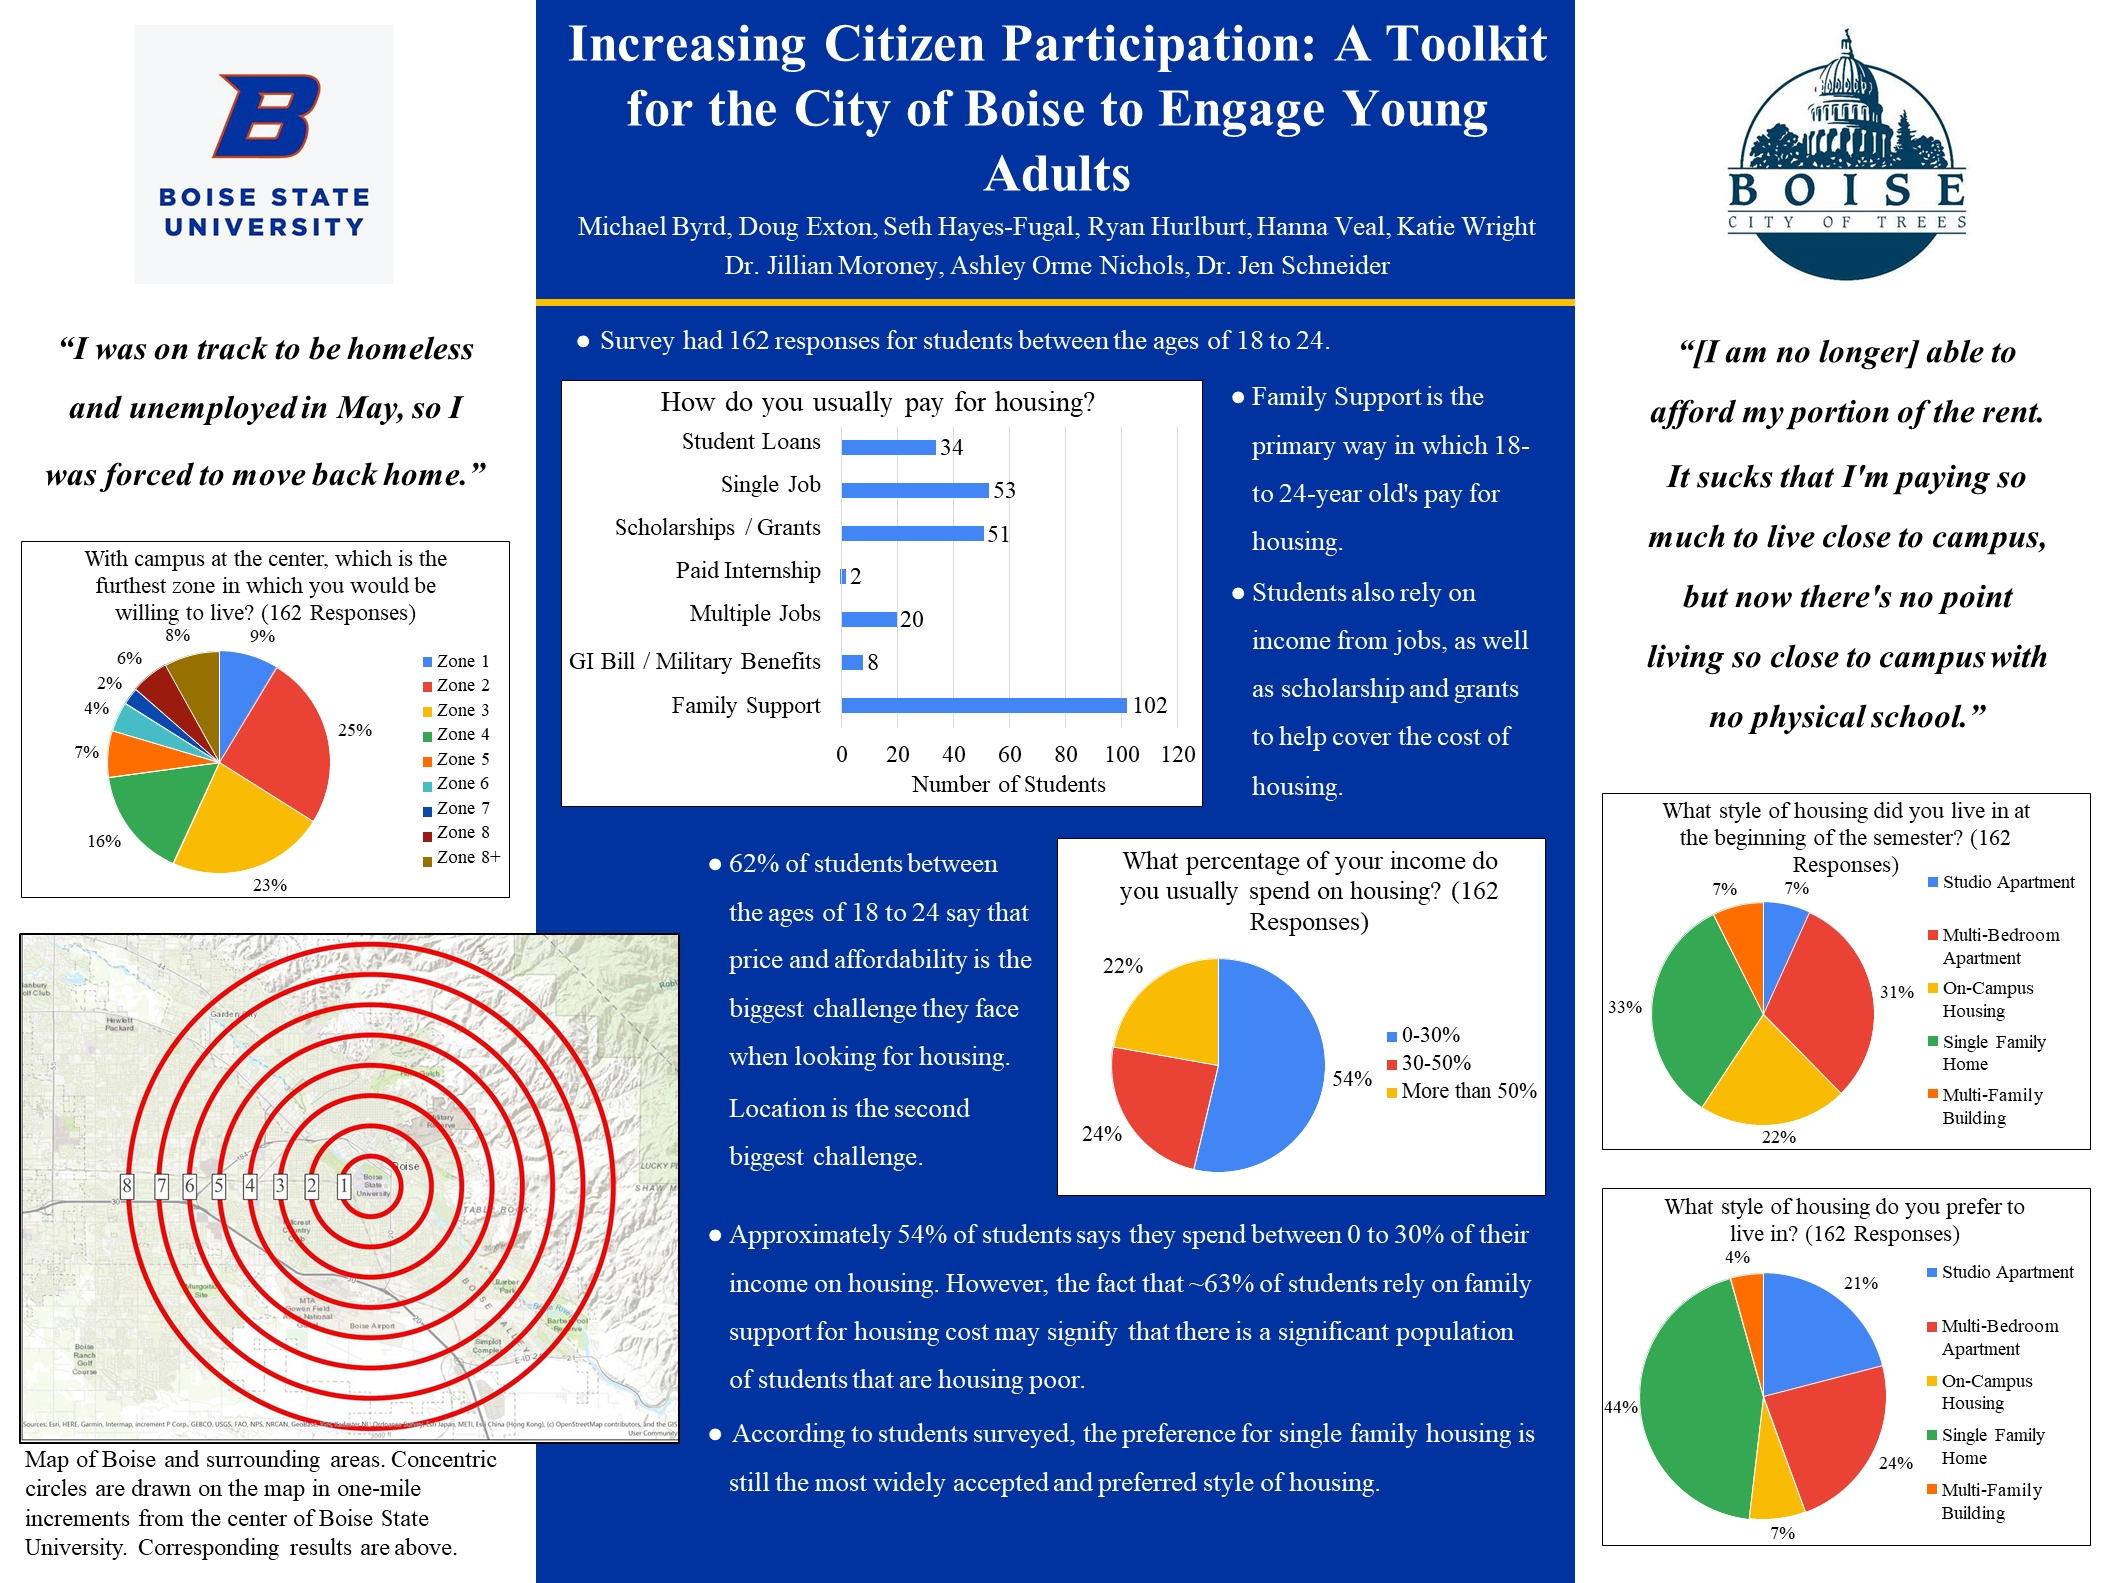
  • Survey had 162 responses for students between the ages of 18 to 24.
  • Family Support is the primary way in which 18- to 24-year old’s pay for housing.
  • Students also rely on income from jobs, as well as scholarship and grants to help cover the cost of
    housing.

“[I am no longer] able to afford my portion of the rent. It sucks that I’m paying so much to live close to campus, but now there’s no point living so close to campus with no physical school.”

Percentage of Income

Pie chart - percent of income
What percentage of your income do you usually spend on housing? (162 responses) 54% spend 0-30% of income, 24% spend 30-50% of income, and 22% spend more than 50% of income on housing.
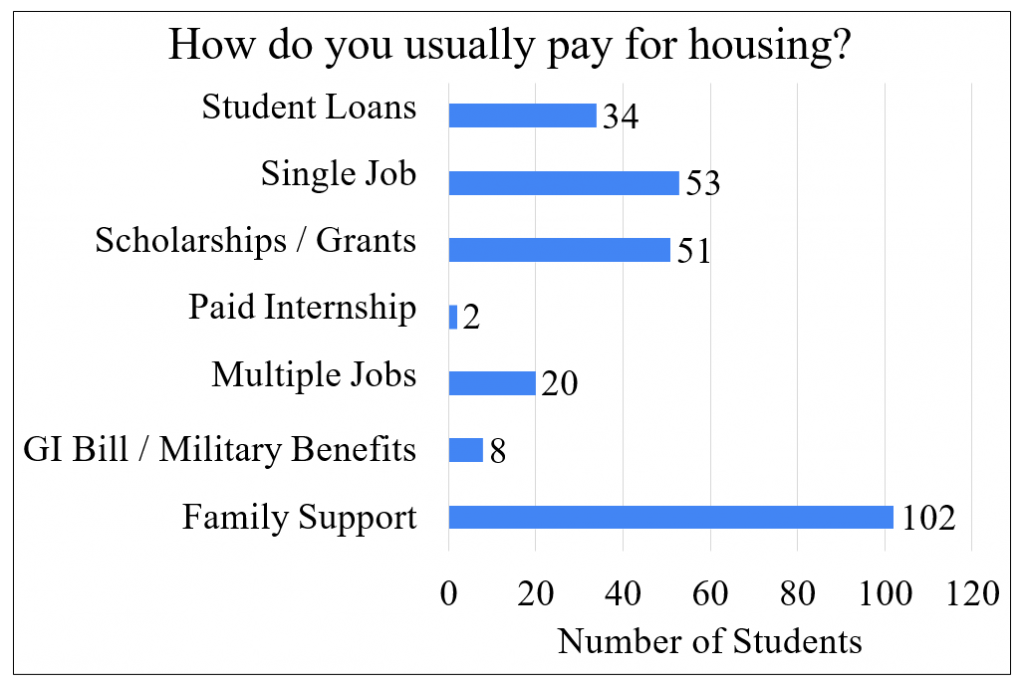
  • 62% of students between the ages of 18 to 24 say that price and affordability is the biggest challenge they face when looking for housing. Location is the second biggest challenge.
  • Approximately 54% of students says they spend between 0 to 30% of their income on housing. However, the fact that ~63% of students rely on family support for housing cost may signify that there is a significant population of students that are housing poor.

“I was on track to be homeless and unemployed in May, so I was forced to move back home.”

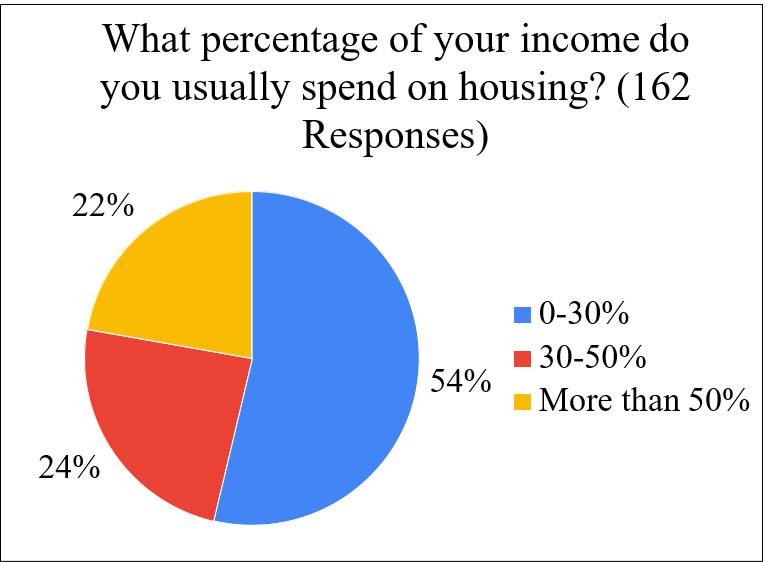
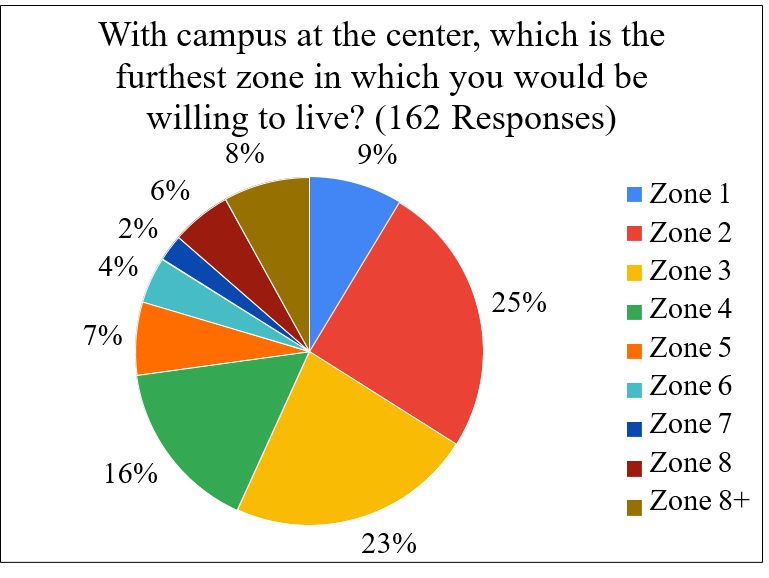
Location from Campus

pie chart - distance from campus
With campus at the center, which is the furthest zone in which you’d be willing to live? (162 responses) 9% Zone 1, 25% Zone 2, 23% Zone 3, 16% Zone 4, 7% Zone 5, 4% Zone 6, 2% Zone 8, 8% Zone 8+
Zones starting at campus and ending roughly at Garden City
Map of Boise and surrounding areas. Concentric circles are drawn on the map in one-mile increments from the center of Boise State University. Corresponding results are above.

Housing Preference

Pie chart - housing at start of semester
What style of housing did you live in at the beginning of the semester? (162 responses) 7% Studio apartment, 31% Multi-bedroom apartment, 22% On-campus housing, 33% Single-family home, 7% Multi-family home.
Pie chart - Housing style
What style of housing do you prefer to live in? (162 responses) 21% Studio apartment, 24% Multi-bedroom apartment, 7% On=Campus housing, 44% Single family home, 4% Multi-famly home
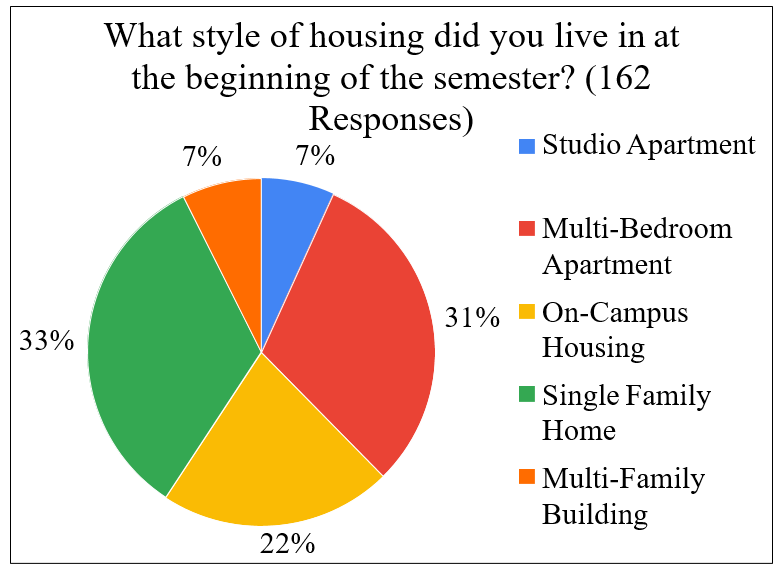
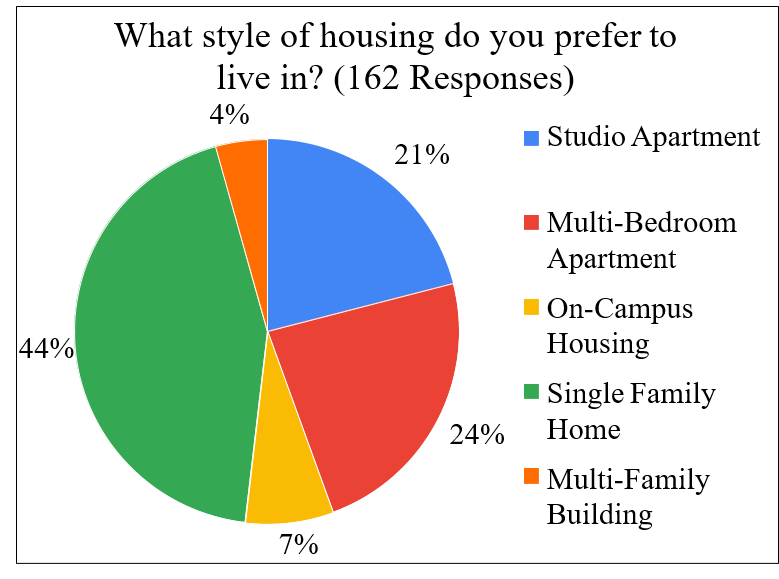
  • According to students surveyed, the preference for single family housing is still the most widely accepted and preferred style of housing.

Additional Information

For questions or comments about this research, contact Michael Byrd at michaelbyrd@u.boisestate.edu.