Associated Water Quality Analysis System, and Specialized Hexacopter
Nicolas Medapalli, Jimin Ryu, Dr. Jae H. Ryu, Dr. Paul Verhage, Sean Boston, Erin Stutzman, Dr. Don L. Warner
Abstract
Water sampling is crucial for water quality management and analysis. However, conventional methods of sampling water can be expensive, dangerous, and inefficient. Areas such as pit mines, flooded plains, and elevated water bodies may be difficult and impractical to reach. This project focused on creating a water sampling apparatus and hexacopter that could effectively and efficiently take remote samples when compared to the current method. Success in our trials was defined as a full sample of approximately 200 mL being collected and returned to the launch site. The apparatus was composed of two separate parts that worked together. The first part was the housing unit for the Raspberry Pi, Arduino, BNC shield, and servo motors. The second part was the sampler itself, which collected the water samples in a bale-system fashion. The water sampler can collect samples at various depths, depending on the dimensions required. The housing unit was attached to the bottom of a custom hexacopter built for water sampling via industrial hooks and nylon cables. This project further built upon the concept of autonomous water sampling via UAVs and implemented water quality analysis mechanisms to the system as well. As of March 2020, when tested at a point of the Boise River, the average pH values using the attached probe was 7.233. The Boise River pH that was last recorded was around 7.4 as of April 2019. This hexacopter sampling apparatus system can be used in the field by other researchers who are in need of a faster, more efficient, process of sampling water.
Background
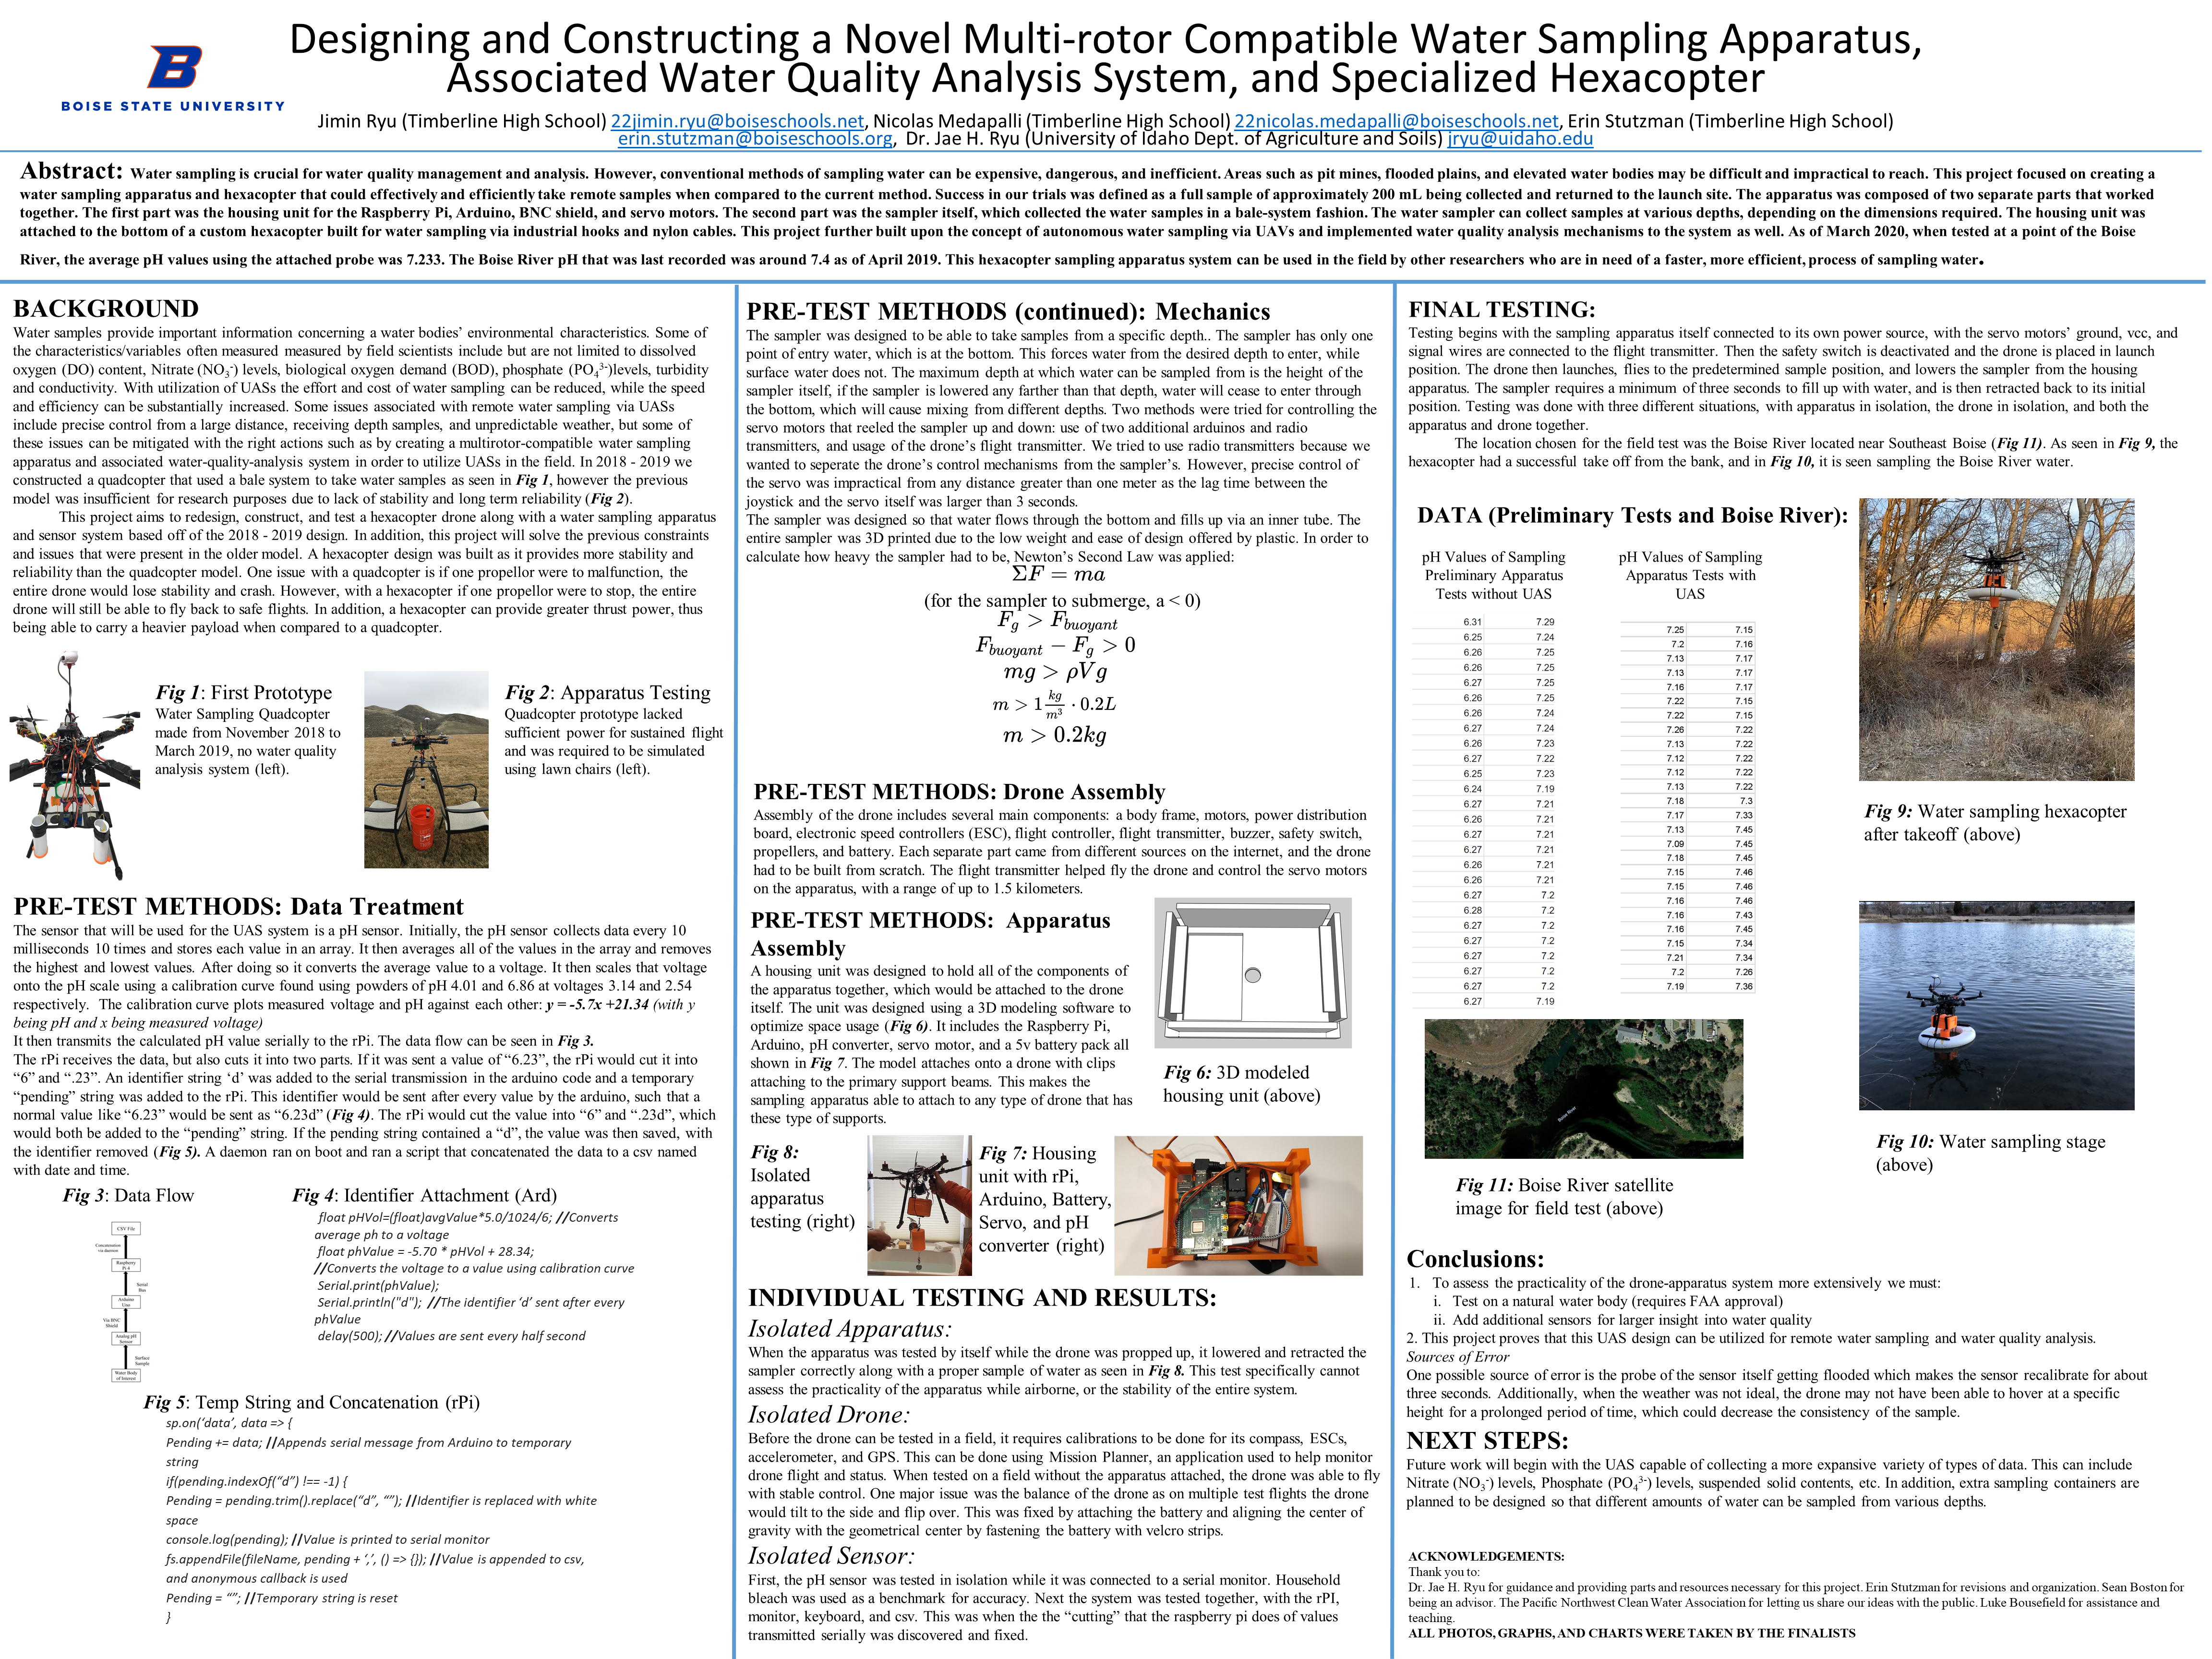
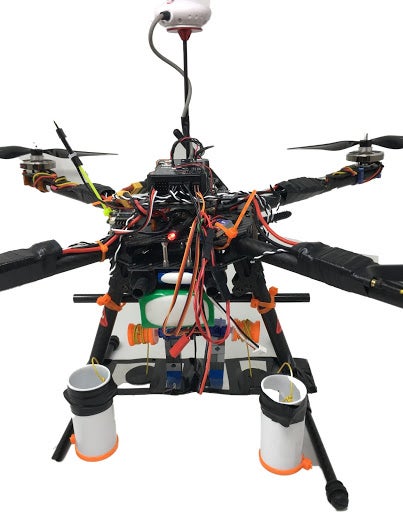
Water samples provide important information concerning a water bodies’ environmental characteristics. Some of the characteristics/variables often measured measured by field scientists include but are not limited to dissolved oxygen (DO) content, Nitrate (NO3–) levels, biological oxygen demand (BOD), phosphate (PO43-) levels, turbidity and conductivity. With utilization of UASs the effort and cost of water sampling can be reduced, while the speed and efficiency can be substantially increased. Some issues associated with remote water sampling via UASs include precise control from a large distance, receiving depth samples, and unpredictable weather, but some of these issues can be mitigated with the right actions such as by creating a multirotor-compatible water sampling apparatus and associated water-quality-analysis system in order to utilize UASs in the field. In 2018 – 2019 we constructed a quadcopter that used a bale system to take water samples as seen in Fig 1, however the previous model was insufficient for research purposes due to lack of stability and long term reliability (Fig 2).
This project aims to redesign, construct, and test a hexacopter drone along with a water sampling apparatus and sensor system based off of the 2018 – 2019 design. In addition, this project will solve the previous constraints and issues that were present in the older model. A hexacopter design was built as it provides more stability and reliability than the quadcopter model. One issue with a quadcopter is if one propellor were to malfunction, the entire drone would lose stability and crash. However, with a hexacopter if one propellor were to stop, the entire drone will still be able to fly back to safe flights. In addition, a hexacopter can provide greater thrust power, thus being able to carry a heavier payload when compared to a quadcopter.
Water Sampling Quadcopter made from November 2018 to March 2019, no water quality analysis system.
Quadcopter prototype lacked sufficient power for sustained flight and was required to be simulated using lawn chairs.
Pre-Test Methods:
Data Treatment
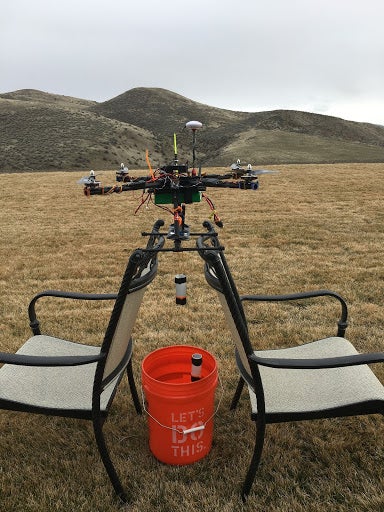
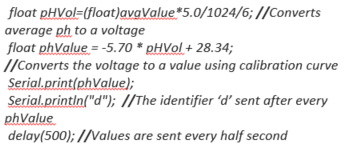
The sensor that will be used for the UAS system is a pH sensor. Initially, the pH sensor collects data every 10 milliseconds 10 times and stores each value in an array. It then averages all of the values in the array and removes the highest and lowest values. After doing so it converts the average value to a voltage. It then scales that voltage onto the pH scale using a calibration curve found using powders of pH 4.01 and 6.86 at voltages 3.14 and 2.54 respectively. The calibration curve plots measured voltage and pH against each other: y = -5.7x +21.34 (with y being pH and x being measured voltage).
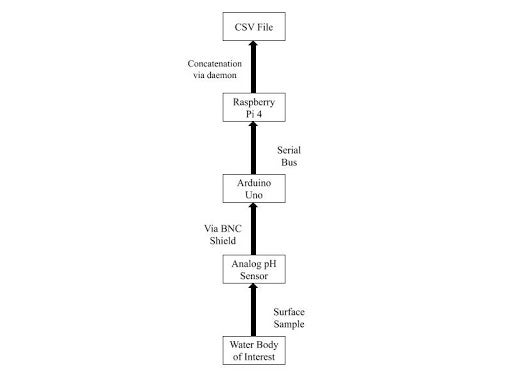
It then transmits the calculated pH value serially to the rPi. The data flow can be seen in Fig 3.
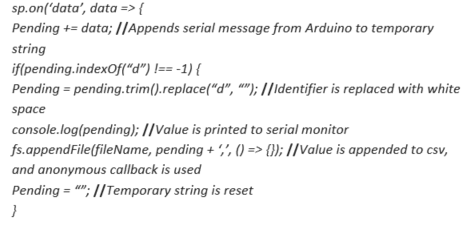
The rPi receives the data, but also cuts it into two parts. If it was sent a value of “6.23”, the rPi would cut it into “6” and “.23”. An identifier string ‘d’ was added to the serial transmission in the arduino code and a temporary “pending” string was added to the rPi. This identifier would be sent after every value by the arduino, such that a normal value like “6.23” would be sent as “6.23d” (Fig 4).
The rPi would cut the value into “6” and “.23d”, which would both be added to the “pending” string. If the pending string contained a “d”, the value was then saved, with the identifier removed (Fig 5). A daemon ran on boot and ran a script that concatenated the data to a csv named with date and time.
Mechanics
The sampler was designed to be able to take samples from a specific depth.. The sampler has only one point of entry water, which is at the bottom. This forces water from the desired depth to enter, while surface water does not. The maximum depth at which water can be sampled from is the height of the sampler itself, if the sampler is lowered any farther than that depth, water will cease to enter through the bottom, which will cause mixing from different depths. Two methods were tried for controlling the servo motors that reeled the sampler up and down: use of two additional arduinos and radio transmitters, and usage of the drone’s flight transmitter. We tried to use radio transmitters because we wanted to separate the drone’s control mechanisms from the sampler’s. However, precise control of the servo was impractical from any distance greater than one meter as the lag time between the joystick and the servo itself was larger than 3 seconds.
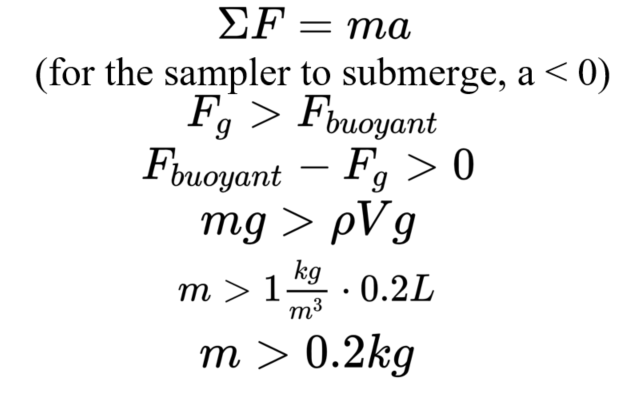
The sampler was designed so that water flows through the bottom and fills up via an inner tube. The entire sampler was 3D printed due to the low weight and ease of design offered by plastic. In order to calculate how heavy the sampler had to be, Newton’s Second Law was applied:
Drone Assembly
Assembly of the drone includes several main components: a body frame, motors, power distribution board, electronic speed controllers (ESC), flight controller, flight transmitter, buzzer, safety switch, propellers, and battery. Each separate part came from different sources on the internet, and the drone had to be built from scratch. The flight transmitter helped fly the drone and control the servo motors on the apparatus, with a range of up to 1.5 kilometers.
Apparatus Assembly
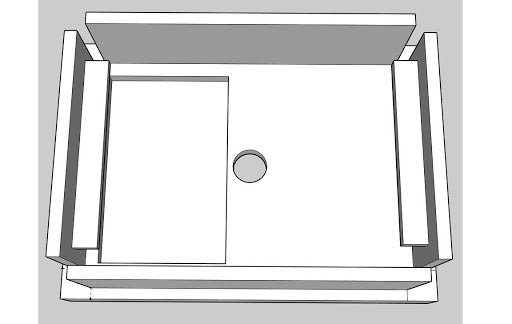
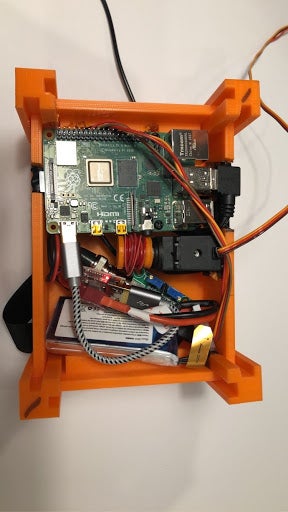
A housing unit was designed to hold all of the components of the apparatus together, which would be attached to the drone itself. The unit was designed using a 3D modeling software to optimize space usage (Fig 6). It includes the Raspberry Pi, Arduino, pH converter, servo motor, and a 5v battery pack all shown in Fig 7. The model attaches onto a drone with clips attaching to the primary support beams. This makes the sampling apparatus able to attach to any type of drone that has these type of supports.
Individual Testing and Results
Isolated Apparatus:
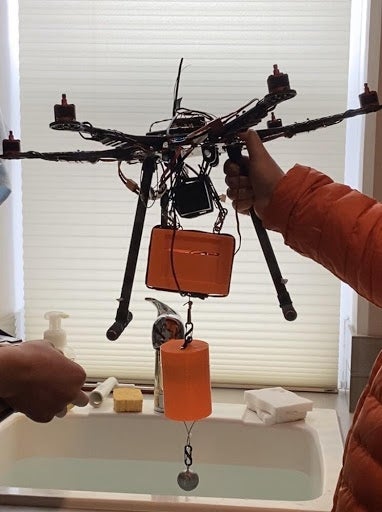
When the apparatus was tested by itself while the drone was propped up, it lowered and retracted the sampler correctly along with a proper sample of water as seen in Fig 8. This test specifically cannot assess the practicality of the apparatus while airborne, or the stability of the entire system.
Isolated Drone:
Before the drone can be tested in a field, it requires calibrations to be done for its compass, ESCs, accelerometer, and GPS. This can be done using Mission Planner, an application used to help monitor drone flight and status. When tested on a field without the apparatus attached, the drone was able to fly with stable control. One major issue was the balance of the drone as on multiple test flights the drone would tilt to the side and flip over. This was fixed by attaching the battery and aligning the center of gravity with the geometrical center by fastening the battery with velcro strips.
Isolated Sensor:
First, the pH sensor was tested in isolation while it was connected to a serial monitor. Household bleach was used as a benchmark for accuracy. Next the system was tested together, with the rPI, monitor, keyboard, and csv. This was when the the “cutting” that the raspberry pi does of values transmitted serially was discovered and fixed.
Final Testing
Testing begins with the sampling apparatus itself connected to its own power source, with the servo motors’ ground, vcc, and signal wires are connected to the flight transmitter. Then the safety switch is deactivated and the drone is placed in launch position. The drone then launches, flies to the predetermined sample position, and lowers the sampler from the housing apparatus. The sampler requires a minimum of three seconds to fill up with water, and is then retracted back to its initial position. Testing was done with three different situations, with apparatus in isolation, the drone in isolation, and both the apparatus and drone together.
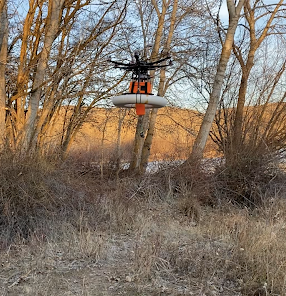
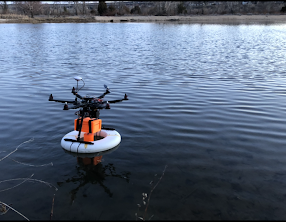
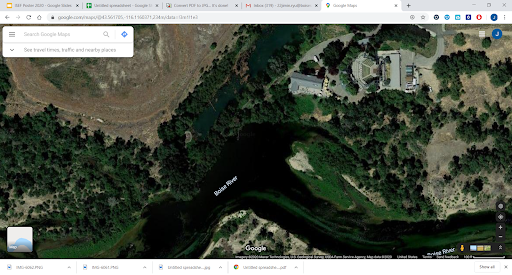
The location chosen for the field test was the Boise River located near Southeast Boise (Fig 11). As seen in Fig 9, the hexacopter had a successful take off from the bank, and in Fig 10, it is seen sampling the Boise River water.
Data
Preliminary Tests and Boise River
pH Values of Sampling Preliminary Apparatus Test without UAS
| 6.31 | 7.29 |
| 6.25 | 7.24 |
| 6.26 | 7.25 |
| 6.26 | 7.25 |
| 6.27 | 7.25 |
| 6.26 | 7.25 |
| 6.27 | 7.24 |
| 6.26 | 7.23 |
| 6.27 | 7.22 |
| 6.25 | 7.23 |
| 6.24 | 7.19 |
| 6.27 | 7.21 |
| 6.26 | 7.21 |
| 6.27 | 7.21 |
| 6.27 | 7.21 |
| 6.26 | 7.21 |
| 6.26 | 7.21 |
| 6.27 | 7.2 |
| 6.28 | 7.2 |
| 6.27 | 7.2 |
| 6.27 | 7.2 |
| 6.27 | 7.2 |
| 6.27 | 7.2 |
| 6.27 | 7.2 |
| 6.27 | 7.2 |
| 6.27 | 7.19 |
pH Values of Sampling Apparatus Tests with UAS
| 7.25 | 7.15 |
| 7.2 | 7.16 |
| 7.13 | 7.17 |
| 7.13 | 7.17 |
| 7.16 | 7.17 |
| 7.22 | 7.15 |
| 7.22 | 7.15 |
| 7.26 | 7.22 |
| 7.13 | 7.22 |
| 7.12 | 7.22 |
| 7.12 | 7.22 |
| 7.13 | 7.22 |
| 7.18 | 7.3 |
| 7.17 | 7.33 |
| 7.13 | 7.45 |
| 7.09 | 7.45 |
| 7.18 | 7.45 |
| 7.15 | 7.46 |
| 7.15 | 7.46 |
| 7.16 | 7.46 |
| 7.16 | 7.46 |
| 7.16 | 7.43 |
| 7.16 | 7.45 |
| 7.15 | 7.34 |
| 7.21 | 7.34 |
| 7.2 | 7.26 |
| 7.19 | 7.36 |
Conclusions
- To assess the practicality of the drone-apparatus system more extensively we must:
Test on a natural water body (requires FAA approval)
Add additional sensors for larger insight into water quality - This project proves that this UAS design can be utilized for remote water sampling and water quality analysis.
Sources of Error
One possible source of error is the probe of the sensor itself getting flooded which makes the sensor recalibrate for about three seconds. Additionally, when the weather was not ideal, the drone may not have been able to hover at a specific height for a prolonged period of time, which could decrease the consistency of the sample.
Next Steps
Future work will begin with the UAS capable of collecting a more expansive variety of types of data. This can include Nitrate (NO3–) levels, phosphate (PO43-) levels, suspended solid contents, etc. In addition, extra sampling containers are planned to be designed so that different amounts of water can be sampled from various depths.
Acknowledgements
Thank you to Dr. Jae H. Ryu for guidance and providing parts and resources necessary for this project. Erin Stutzman for revisions and organization. Sean Boston for being an advisor. The Pacific Northwest Clean Water Association for letting us share our ideas with the public. Luke Bousefield for assistance and teaching.
ALL PHOTOS, GRAPHS, AND CHARTS WERE TAKEN BY THE FINALISTS