
Sarah Coose, Edward Trout, Dr. Neil Carter, Dr. Kelly Hopping, Kris Thoreson, Greg Hill
Background
As the human population grows, humans and animals increasingly share space – potentially leading to human-wildlife conflict in natural spaces.
Methods
Data Collection
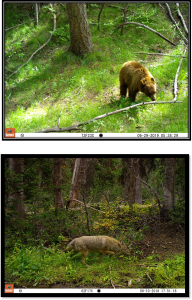
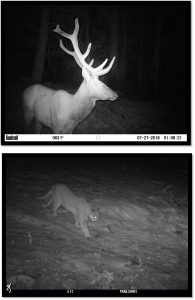
Deployed 48 infrared-trigger field cameras along various trails in the Wood River Valley.
Spatial Analysis : Hurdle Model
Uses binomial andnegative binomial regression to describe whether number of human detections is correlated with the presence or absence and/or abundance of a species.
Temporal Analysis: Coefficient of Overlap
Describes how much the temporal activity patterns each species overlaps with human recreation.
Results
Binomial regression
There was no significant correlation between number of human detections and the presence or absence of any species.
Negative binomial regression (n = 48)
- High recreation correlates with low abundance of elk (p = 0.004).
- High recreation correlates with high abundance of bear (p = 0.012), coyote (p = <0.001), and wolf (p = <0.001).
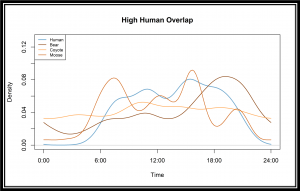
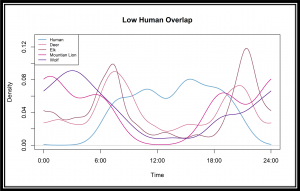
Temporal analysis
There was a general trend of two groups of animals – one with high coefficients of overlap and one with a low coefficients of overlap
Further Details
Spatial Analysis : Hurdle Model
Binomial regression example
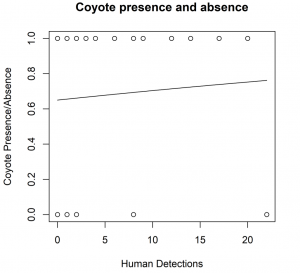
Higher number of human detections correlated with a higher probability of coyote presence.
Negative Binomial Regression example
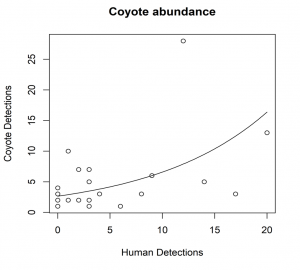
Higher number of human detections correlated with higher number of coyote detections
Temporal Analysis: Coefficients of Overlap
Mean coefficient of overlap with 95% CI. General trend shows coyote, bear, and moose with high overlap and elk, mountain lion, and wolf with low overlap.
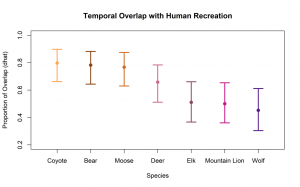
Many species use the same trails as humans, but different strategies in how they spend their time.
High Human Overlap
Low Human Overlap
Conclusion
High recreation correlated with higher presence of bear, coyote and wolf. However, these species utilized different temporal strategies.
Additional Information
For questions or comments about this research, contact Sarah Coose at sarahcoose@u.boisestate.edu.