-by Forrest Burt (Burt is a former high performance computing analyst in the Office of Research Computing)
“We study the extreme sea levels of coastal locations around the world,” said doctoral student Mintaek Lee. “Outside factors – changes in the instrument, location of the measurements, earthquakes, land reclamation, dredging – all these things can influence the baseline distribution of sea levels. My research focuses on identifying the inhomogeneous shifts in their mean levels which are potentially induced by those factors, so we can rigorously estimate the long-term trends in the extreme coastal sea levels.”
Lee, a doctoral student in the Computing program looks at “change points” in extreme coastal sea levels around the world. Alongside his advisor, professor Jaechoul Lee, the two work to identify points where the mean levels shift drastically from the extreme sea level, which could be due to outside influence.
This is important because many researchers are using the same datasets to study extreme sea levels as Lee, and these change points should potentially be accounted for in their research. 70% of the data in these datasets comes collectively from the British Oceanographic Society and the University of Hawaii Sea Level Center, with the remaining 30% coming from various government agencies.
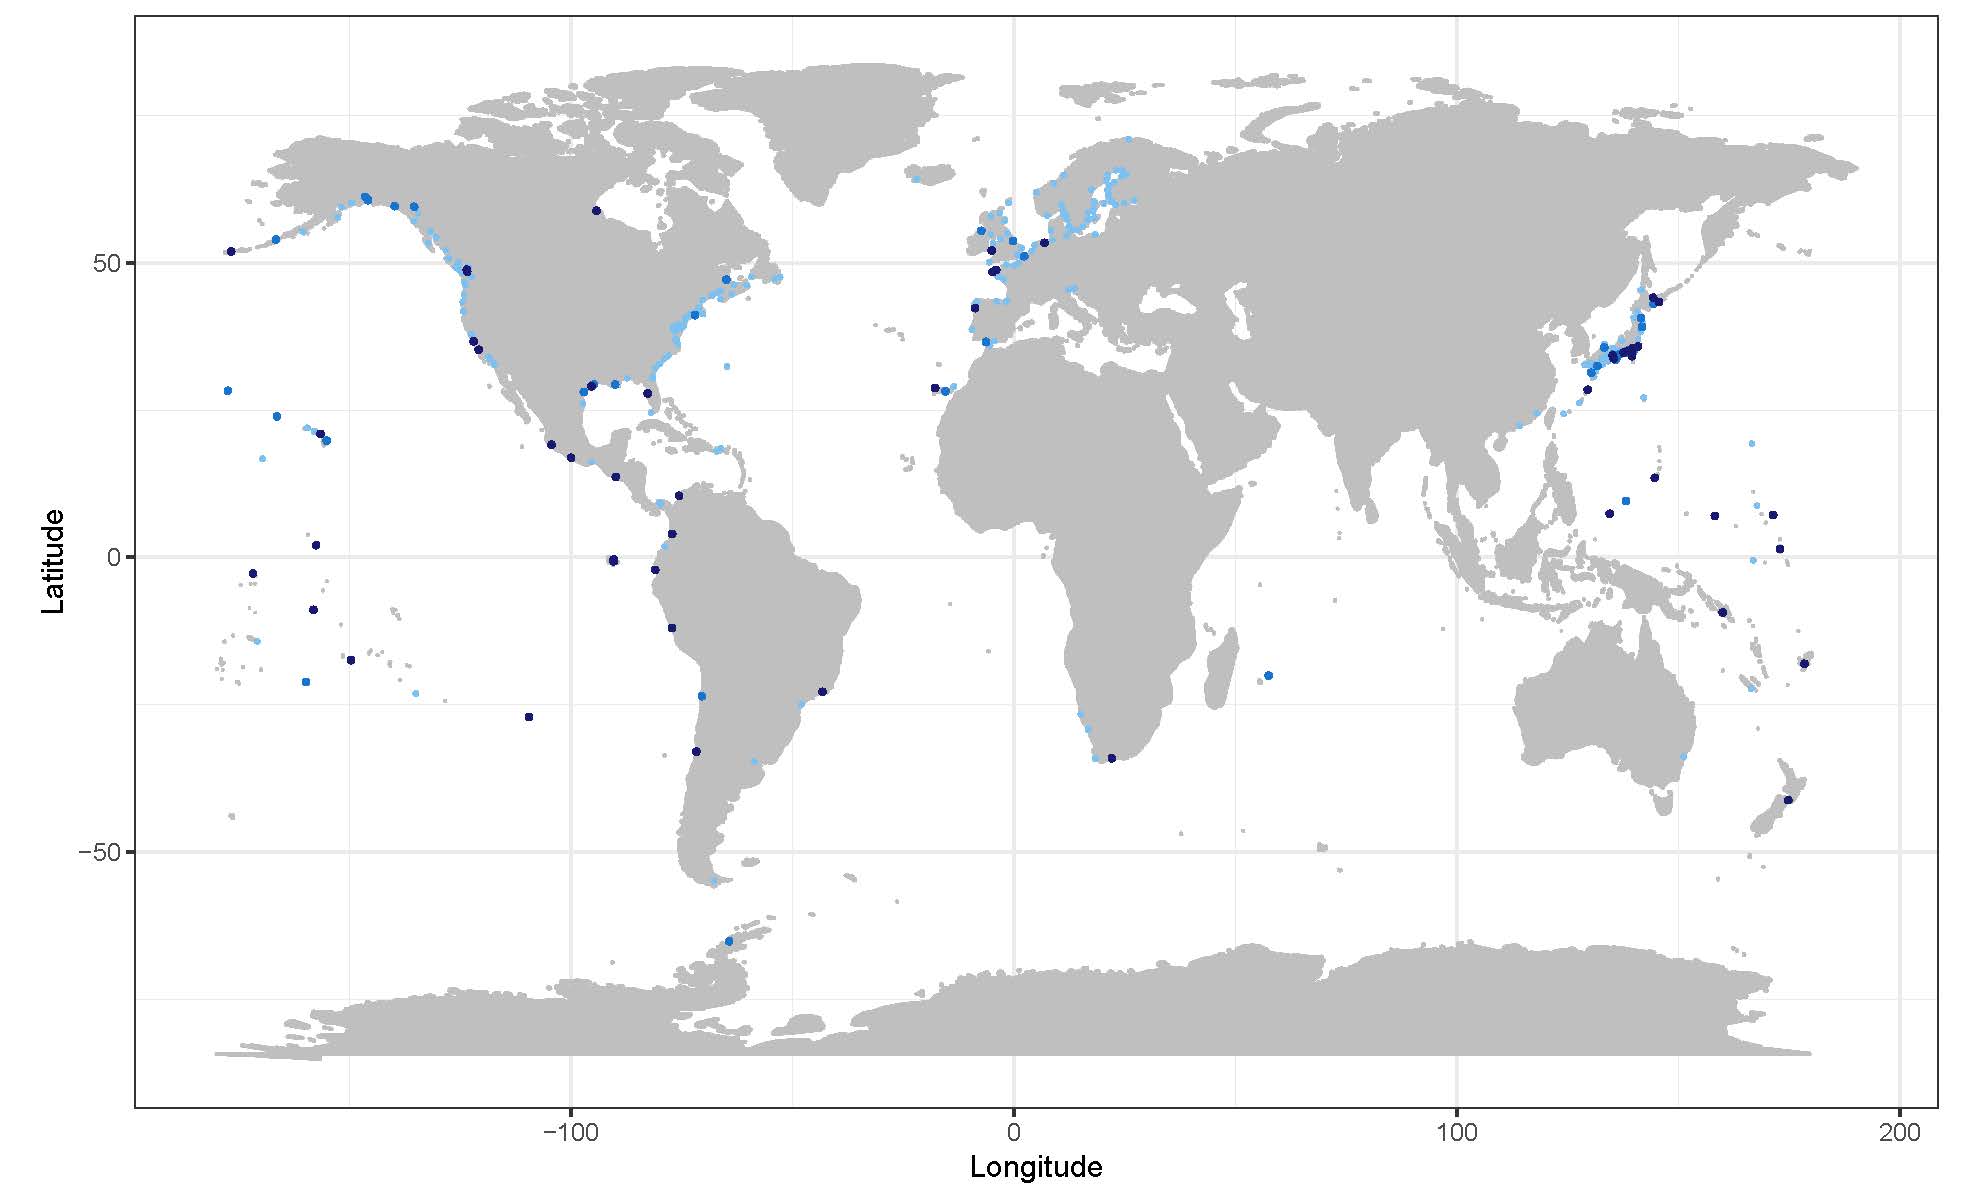
The above figure shows the spatial location of the tide gauges where the consideration of changepoints changed the estimated trends by more than 40 cm century^{-1} (52 sites, dark blue), between 20 and 40 cm century^{-1} (37 sites, blue), and less than 20 cm century^{-1} (211 sites, light blue).
To assess his method of finding these change points, Lee uses a genetic algorithm. A genetic algorithm mimics the process of natural selection to identify change points in the extreme sea levels, but is computationally expensive. Lee considered eight different scenarios that he wanted to test in his simulation study, and needed to run the genetic algorithm 1000 times on each scenario.
“If I were running this on my computer, it would have taken anywhere between one to two hours per repetition – three weeks of straight computing on my computer. I was also impressed at how R2 was much faster than the department server. It was a steep learning curve to get up and running, but Kelly and Mike [Research Computing’s high performance computing engineers] were both really, really helpful.”
There have been prior studies that have looked into these extreme sea levels, but do not consider the change points that Lee studies. Lee found that at 52 sites worldwide, considering the change point altered the expected trend by over 40 centimeters per century. He also found many other places where considering change points altered the trend by a lesser, but still significant, amount.
“There are locations everywhere – Great Britain, Europe, Japan – that had shifts in their means after considering the change points. Although the cause is still unknown, it appears that some are natural shifts and some are human-caused – we take these change points into account in our analysis and think that it’s something worth looking into for climatologists or oceanographers,” said Lee.
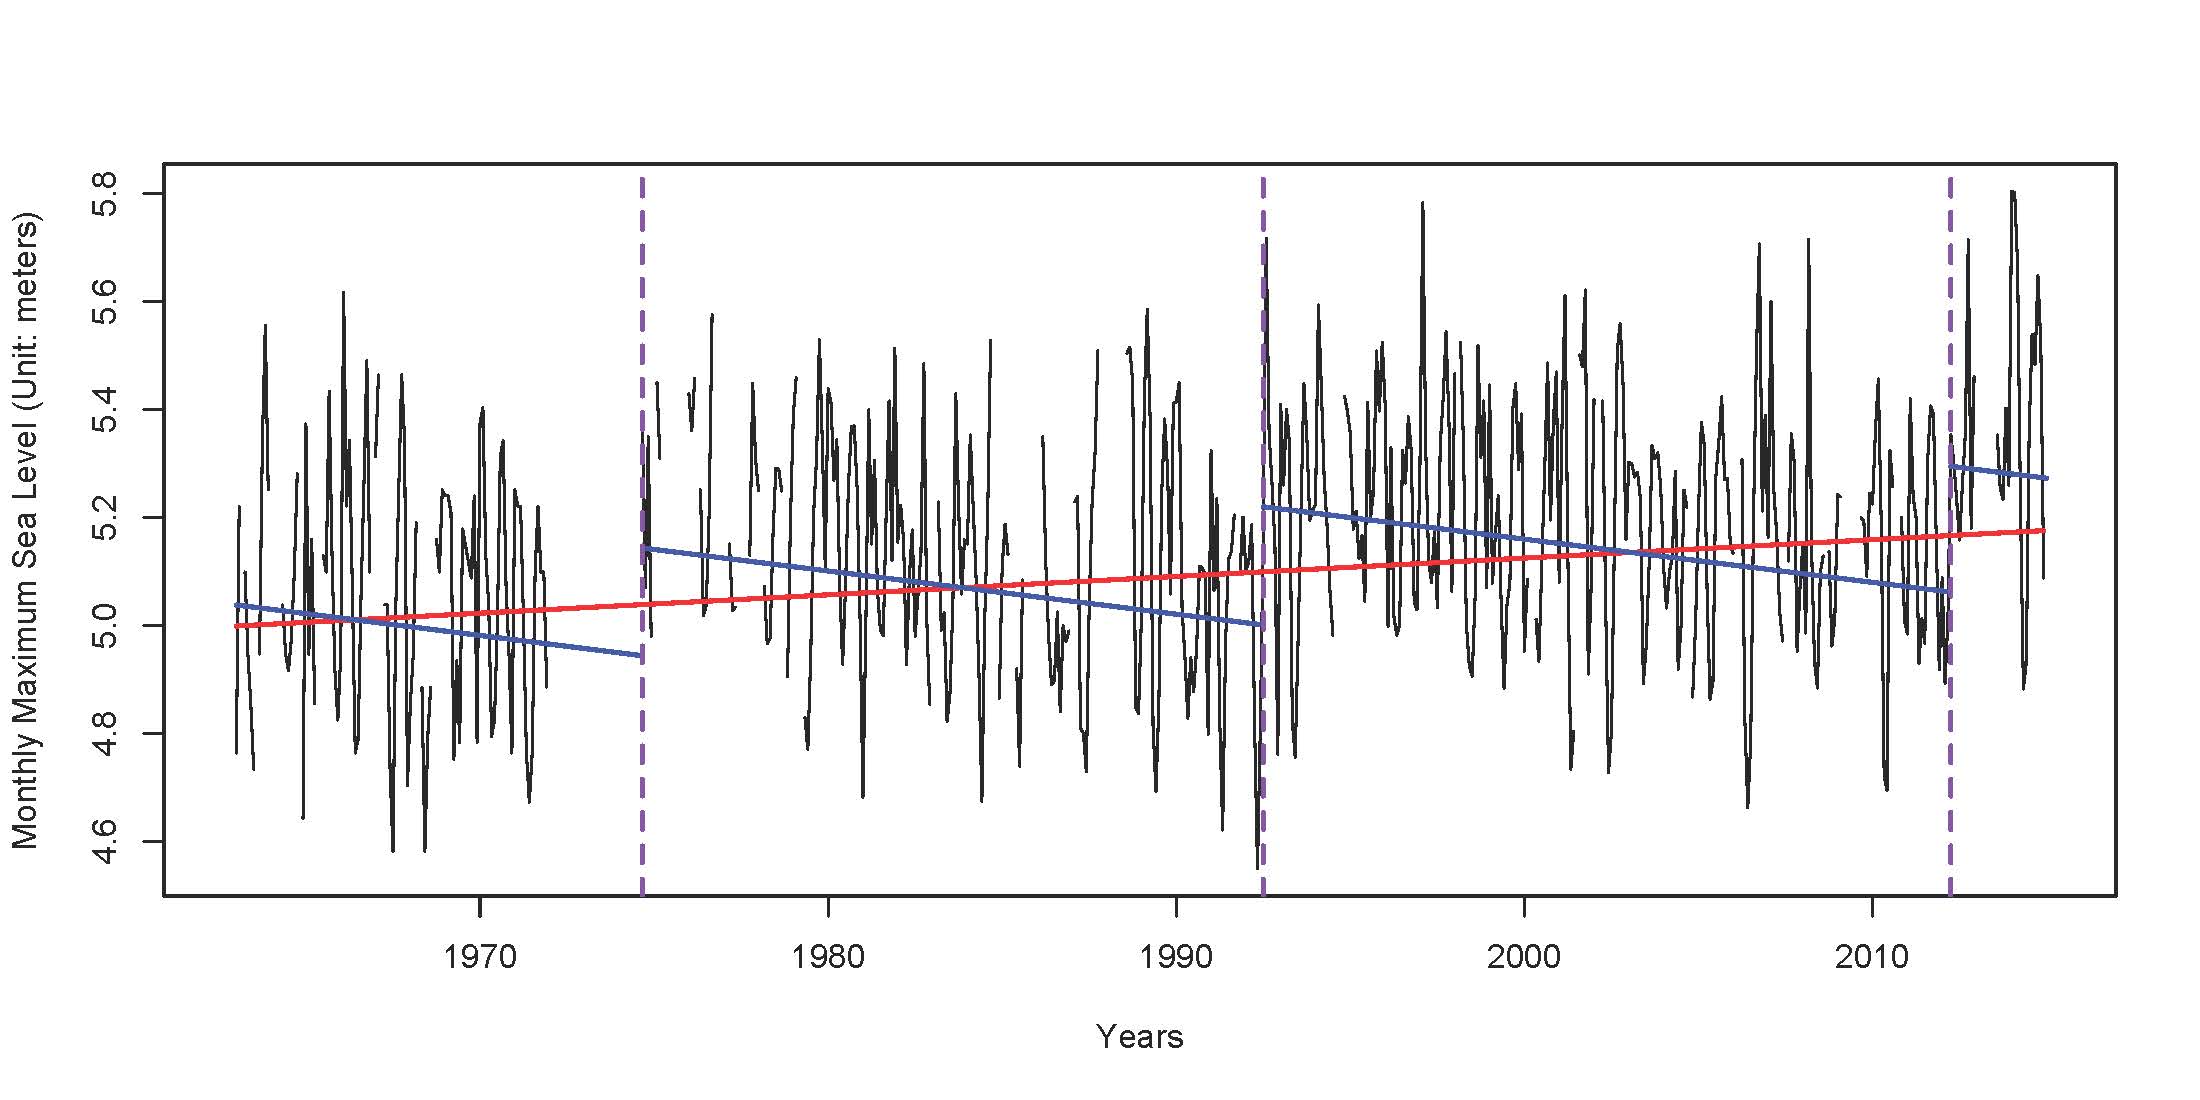
The figure above shows estimated trend lines for the Fishguard monthly maximum sea levels (blue solid lines, the trend with three GA estimated changepoint times; red solid line, the trend without allowing changepoints) in the case study location (Fishguard, UK). The plot shows that without considering changepoints, the extreme sea levels of Fishguard appear to have been increasing over time (red line). However, with two changepoints estimated by the genetic algorithm considered in the study analysis, it’s observed that the extreme sea levels of Fishguard have in fact been decreasing over time (blue line), illustrating the necessity of taking those shifts into account in estimating the long-term trends in the extreme coastal sea levels.
“Many extreme climate events, like extreme precipitation or temperatures, often bring damages that can be recovered. But rises in extreme sea levels often bring damages that are perhaps harder to recover. I wanted to study these changes and be at least a small part of the efforts taken against them,” Lee continued.
Lee will be finishing his PhD in summer 2022.