
Dr. Burkhart specializes in research on explanatory factors of cross-national democratization patterns, Canada-US borderlands and environmental policy, and political culture. He earned his Ph.D. from the University of Iowa and has been a visiting professor at the Norwegian Technical and National University in Trondheim, Norway. Dr. Burkhart’s book Turmoil in American Public Policy: Science, Democracy, and the Environment, was published by Praeger Press (2010). His research has also been published in several peer-reviewed journals, including American Political Science Review, American Review of Canadian Studies, European Journal of Political Research, Journal of Borderlands Studies, Journal of Politics, Social Science Journal, and Social Science Quarterly.
The stunning results from the 2016 U.S. presidential election, which were contrary to nearly every expert prognostication, also produced considerable criticism directed towards the growing election forecasting industry, as it nearly en masse appeared to pick the wrong candidate to win: Hillary Clinton. But just how off were the forecasts from their purported efforts in forecasting the winner? The answer is not so much, once we are clear on just what the models were forecasting, and the best of these forecasts may surprise you.
We will focus on assessing the forecasts from the quantitative election forecasting industry, as we want to determine the numerical forecasting error. Thus, we will not consider here the more subjective, and thus not replicable, election forecasting efforts of, for instance, The Cook Political Report (final forecast leaning toward Clinton), Allan Lichtman’s Keys to the White House (Trump victory), Larry J. Sabato’s Crystal Ball (leaning toward Clinton), and The Rothenberg & Gonzales Political Report (leaning toward Clinton), though these too were generally off the mark in their final forecasts.
Instead, we will examine a dozen quantitative election forecasts, as they are in theory replicable, meaning that outside analysts can take the data and models the forecasters use and arrive at the same results using the same analytical techniques. Rather than replicate these forecast models, we will compare their forecasts and assess their error in forecasting the final election result.
ELECTION FORECASTING: A PRIMER
Before discussing the relative accuracy of the various 2016 election forecasts, it makes sense to clarify what is meant by that term. By election “forecast”, I refer to three basic elements: accuracy (the forecast accurately predicts the final election result), parsimony (models use as few independent variables as necessary in order to make the election forecast), and lead time (the forecast is made at a time point substantially prior to the election).
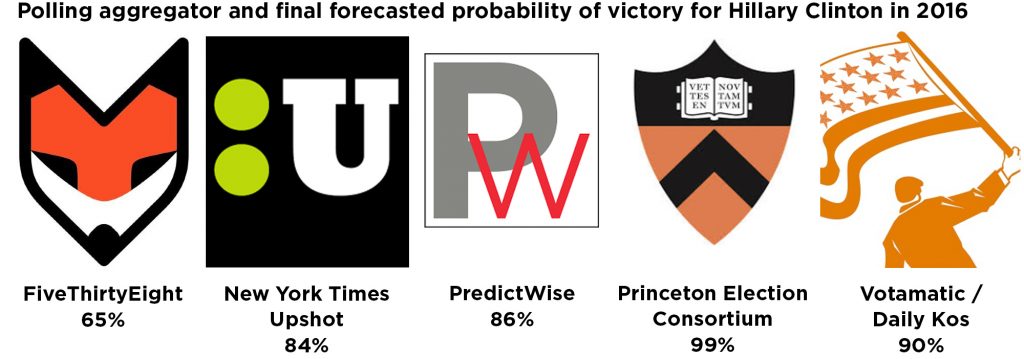
There were two types of quantitative election forecasting during the 2016 elections. The first type is based on polling aggregation, with the guiding idea that the averaging of polling results will lead to the most likely election result. These daily forecasts were eagerly consumed by the media and public. Polling aggregators use thousands of state and national polls, and some also account for “election fundamentals”, to publish an average and comprehensive daily forecast. Polling aggregators had their start in the 2008 presidential elections, with Nate Silver becoming the industry leader with his FiveThirtyEight data journalism operation. The polling aggregators for this election cycle include the following efforts, paired below with their lead forecaster and final forecasted probability of victory for Hillary Clinton in 2016:
- FiveThirtyEight – Nate Silver – 65%
- New York Times Upshot – Nate Cohn – 84%
- PredictWise – David Rothschild – 86%
- Princeton Election Consortium – Sam Wang – 99%
- Votamatic / Daily Kos – Drew Linzer – 90%
As we can see, the forecasters were rather confident in their belief that Clinton would win the election, though Silver was notably less confident than his colleagues.
How do the polling aggregators work? They use an averaging methodology that takes repeated public opinion snapshots of the voting public, enough to paint a daily picture of the electorate in all of its vicissitudes, yet discounts polling results from more distant time periods. The daily forecasts are expressed in probabilities of the major presidential candidates winning the general election. These probabilities became popular with the public, and the probabilities were even compared to probabilities of other common events taking place. (For instance, The New York Times Upshot tended to compare the likelihood of a Hillary Clinton victory to that of a National Football League placekicker converting a field goal attempt from a relatively short-to-moderate yardage on the field.)
The second type of quantitative election forecast is termed single-point estimation, issued by academic teams of researchers, and receive less publicity than do the polling aggregators. How do the single-point estimation forecasters work? They lay out a theoretical rationale for voting and specify independent variables to reflect that theory in equations to be estimated using readily available time-series data that exist well prior to the election date. The preferred statistical technique is regression analysis, which yields an easily interpretable equation. These forecasters make their forecasts relatively early in the election campaign, based on the parameters of their estimated equations and plugging current values of their independent variables into their models to arrive at a single forecast of the major two-party vote for the White House incumbent party (in this election, Hillary Clinton). These forecasts are not updated, unlike those of the polling aggregators: the forecast remains in place throughout the campaign season and on Election Day.
This modeling began in earnest in the early 1980s, with guiding principles that place an emphasis on predicting as a fundamental scientific enterprise that should be on equal footing with that of seeking explanations for voting behavior. The media do report on these forecasts, but since they are issued at one time point, they quickly lose media interest. The single-point models for the 2016 elections were summarized in the October 2016 issue of PS: Political Science and Politics:
- Alan I. Abramowitz – “Time for a Change”
- James E. Campbell – “Trial Heat and Economy” and “Convention Bump and Economy”
- Robert S. Erikson and Christopher Wlezien – “Leading Economic Indicators and the Polls”
- Andreas Graef, J. Scott Armstrong, Randall J. Jones, Jr., and Alfred G. Cuzán – “Combining Forecasts”
- Thomas M. Holbrook – “National Conditions and Trial Heat”
- Bruno Jerôme and Véronique Jerôme-Speziari – “State-by-State Political Economy”
- Michael S. Lewis-Beck and Charles Tien – “Politics, Economics, and Institutions Presidential Forecast”
- Brad Lockerbie – “Economic Expectations and Political Punishment”
- Helmut Norpoth – “The Primary Model”
Common to these models are independent variables that measure economic conditions at the national and state level such as GDP growth and leading economic indicators, and political conditions such as presidential popularity, primary results, and trial heat polls. All variables are measured well in advance of the election date, sometimes nearly a year prior, as in Helmut Norpoth’s primary model. The intent is to forecast based upon models built using solid voting behavior theory, estimated with non-trivial lead time, and distinguished by the high predictive power of the final result.
WHICH APPROACH PERFORMED BETTER?
Our task is to compare the results of these different approaches. A reasonable head-to-head comparison between the polling aggregators and the single-point forecasters is to analyze their closeness to the final result on the day that the single-point forecasters make their forecast. The only polling aggregator that made a forecast comparable to the dependent variable of choice for the single-point forecasters, the percentage of the two-party vote won by the incumbent party presidential candidate, is Nate Silver’s FiveThirtyEight website. (The popular vote percentage forecasts that FiveThirtyEight published were for all candidates running. Thus, I used the law of proportions to convert the FiveThirtyEight percentages to two-party popular vote forecasts.)
I tracked the forecasts that FiveThirtyEight made on each release date of the predictions made by the single-point forecasters. I subtracted their forecasts from the final election result, listed in the column “Forecast Error” and compared the deviations to the “Silver Polls-Plus Forecast Error”. The Polls-Plus forecast is meant to be the most comprehensive of the FiveThirtyEight forecasts, and thus should be of an equal power to the single-point forecasts. In addition, I take the absolute values of these deviations (switching negative numbers to positive) to arrive at an average absolute deviation so as to compare the average deviation from all eleven single-point forecasters to the eleven forecasts by FiveThirtyEight on those forecast dates.
TABLE 1: The 2016 Presidential Election Single-Point Forecasts and the FiveThirtyEight Forecasts (Columns Labeled As “Silver”) on the Release Date of Each of the Single-Point Forecasts (Two-Party Popular Vote for Incumbent Party Candidate)
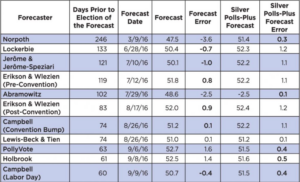
Of the eleven single-point forecasts, six were closer to the final election result than were the FiveThirtyEight Polls-Plus forecasts on the days the single-point forecasts were released with one tie (Lewis-Beck and Tien and Silver at 0.1 percent error in absolute terms). The closer forecasts were Campbell (Convention Bump) at 0.1 percent error, Campbell (Labor Day) at 0.4 percent error, Lockerbie at 0.7 percent error, Erikson and Wlezien (Pre-Convention) at 0.8 percent error, Erikson and Wlezien (Post-Convention) at 0.9 percent error, and Jerôme and Jerôme-Speziari at 1.0 percent error. Of the four single-point forecasts that were farther off from the FiveThirtyEight forecasts, two of them, Abramowitz’s forecast at 2.5 percent error and Norpoth’s forecast at 3.6 percent error, predicted that Donald Trump would win the majority of the popular vote. The other two, Holbrook at 1.4 percent error and PollyVote (a type of aggregation of forecasts) at 1.6 percent error, overestimated the popular vote for Hillary Clinton.
Overall, perhaps somewhat surprisingly, given the high degree of publicity for the polling aggregators (the FiveThirtyEight website was accessed more than 92 million times during October 2016 according to its press release), the single-point forecasters proved that their models provided a parsimonious yet rich and extremely close prediction of the vote, well before the election date, with relatively low data demands, as opposed to the heavy data consumption of the polling aggregators. It is also remarkable that there is such agreement between the forecasts, with the range of forecast errors for the single-point forecasters being from -3.6 percent to 1.6 percent of the two-party voteshare, and the range for the FiveThirtyEight polls-plus forecasts being from 0.1 percent to 1.3 percent of the two-party voteshare. The average absolute errors are also quite small: 1.19 percent for the single-point forecasters, .69 percent for the FiveThirtyEight polls-plus forecasts. By any standard, these forecasts are reliable.
However, these models were all forecasting a constitutional irrelevancy of American government: the two-party popular vote for president as opposed to the electoral vote for president. No matter how close these forecasts were for the popular vote, only two of them forecasted the correct winning candidate, Donald Trump: Abramowitz and Norpoth. (Interestingly, at no point did the FiveThirtyEight polls-plus popular vote forecast ever show Donald Trump in the lead.)
THE FUTURE OF ELECTION FORECASTING
These results raise an important question: should we give as much consideration as we do to the election forecasting industry if it cannot point us in the direction of the eventual winning candidate? Normally, the common response is to state that the two-party popular vote is highly positively correlated to the electoral vote, meaning that they should both track very closely. Indeed, the Pearson correlation between the winning two-party popular vote and winning electoral vote is .92 between 1948 – 2016. Yet the correlation has not always been so high, historically speaking: between 1920 – 2016 the correlation is .75, and between 1824 – 2016 the correlation is .67. These lower correlations remind us that close tracking is not perfect tracking, witness this fourth instance of the electoral vote not corresponding to the known public vote since 1828, and the second instance in the five most recent presidential elections.
Many reasons are given for these two recent abnormalities, though a version of the “stalled electorate” moniker first used to analyze French elections seems appropriate to explain the frequent modern occurrence of the discrepancy. A bicoastal Democratic Party domination of presidential elections is mirrored by an equally dominant interior Republican Party domination, with about a dozen swing states in the interior determining the eventual winner.
While, in the end, the election forecasting industry was heavily critiqued by the media for getting their forecast wrong, the quantitative forecasters who focused on two-party popular vote were largely on target. By the date of the electors of the Electoral College meetings in the 50 states and the District of Columbia on December 19th, 2016, Hillary Clinton led by more than 2.86 million voters nationwide, or 51.1 percent of the two-party vote. That margin of popular vote victory is larger than the margin in such recent elections as 2000, 1960, 1968, and 1976. The single-point forecasters and the polling aggregators largely foresaw this margin, and if anything, the single-point forecasters were slightly more prescient than their flashier polling aggregator cousins in modeling the voteshare. More broadly, if “the acid test of a science is its utility in forecasting”, then the forecasting industry as a scientific enterprise must continue, and based on these close forecasts of the actual vote, the efforts are encouraging indeed.