Summary of instructions to use the MvCAT toolbox:
Purpose: MvCAT is developed in matlab as a user-friendly toolbox (software) to help scientists and researchers perform rigorous and comprehensive multivariate dependence analysis. It uses 26 copula families with 1 to 3 degrees of freedom to create joint probability distributions from two interdependent random variables. It uses local optimization and/or Markov chain Monte Carlo simulation within a Bayesian framework to infer the parameter values of the copula families by contrasting them against available data. If Bayesian analysis with MCMC simulation is performed, an estimate of uncertainty for each copula family can be provided from the posterior distribution of copula parameters. MCMC within Bayesian framework not only provide a robust estimate of the global optima, but also approximate the posterior distribution of the copula families which can be used to construct a prediction uncertainty range for the copulas. Local optimization methods are prone to getting trapped in local optima.
User is free to choose any subset of the available 26 copula families, and MvCAT will perform the analysis and rank the selected copula families based on their performance. Performance metrics used in this toolbox are Likelihood, Akaike Information Criterion (AIC), Bayesian Information Criterion (BIC), Nash-Sutcliffe Efficiency (NSE), and Root Mean Squared Error (RMSE). While Likelihood, NSE and RMSE only focus on minimizing the residuals between observations and model simulations, other metrics take into consideration additional criteria. For example, AIC takes into account the model complexity and BIC account for model complexity and number of observations.
For more info and reference: Sadegh, M., Ragno, E. and AghaKouchak, A. (2017), Multivariate Copula Analysis Toolbox (MvCAT): Describing dependence and underlying uncertainty using a Bayesian framework. Water Resour. Res. doi:10.1002/2016WR020242
How to Run
Make sure to change the directory of matlab, to the directory that you saved the MvCAT files in.
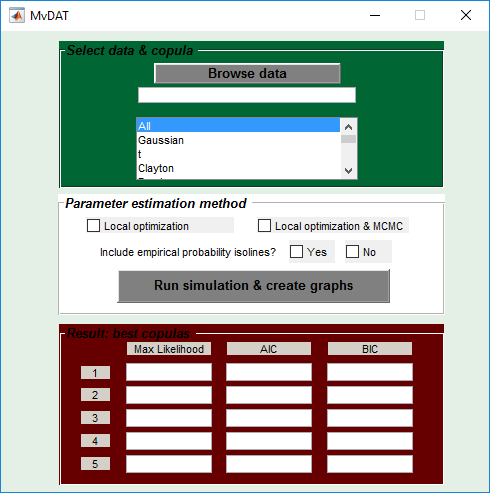
- GUI: Run “MvCAT.m” in matlab to open up the graphical user interface. In the GUI you would need to select input data by browsing through “Browse Data” button, and select any subset of copula families. (In order to choose several families you would need to hold “Ctrl” button and click on the desired copula family.) Default is that you would like to try all provided copula families (“All”). Next step is to either select “Local Optimization” OR “Local Optimization and MCMC”. Next step is to choose whether you like to see empirical bivariate probability isolines in your final figure or not. Default is “not”! Now click “Run simulation & create graphs”.
- Script: Run “Run_MvCAT_Script.m” in matlab. You can first modify the script by assigning the input data file to load, selecting whether you would like to see the bivariate empirical probability isolines, choosing type of the optimization algorithm, and ID of which copula families. Please follow the comments in the script for any modification. Failure to follow the comments may result in error warnings in matlab.
Input
Input file is a text file (“.txt” format) with the observations of the two variables in two columns without any header. The current version of MvCAT only works for bivariate analysis.
Outputs
Outputs include figures with “.fig” format that depict posterior distribution of selected copula parameters, if MCMC is selected, as well as probability isoline (0.1-0.9) figures in the probability space and in the actual variable space. Same figures will be saved into a folder entitled “Results” with a “.png” format. MvCAT will also write a text file and report out the performances of different copulas based on Likelihood value, AIC and BIC. Summary report also include the NSE and RMSE associated with each copula family as well as their parameter values and their uncertainty ranges, if MCMC is selected. Note that all metrics reported are associated with MCMC best parameter set, if this option is selected. Finally, potential warnings will be reported, such as if a parameter value hits the boundary limit, or if a copula family is not proper to analyze the data.
Remarks
- Empirical marginal distributions are used in this toolbox, as opposed to those which employ normal distribution assumptions to estimate the probability of data. We avoid imposing such additional assumptions by using the empirical probabilities.
- The final figures that plot probability isolines in the actual variable space assume a marginal normal distribution to invert from probability space to actual value space. Care is advised when using these graphs.
Download MvCAT:
MvCAT_Share (email mojtabasadegh@boisestate.edu to ask for .zip file)