Dots-on-Plots
Description: Dots-on-PlotsTM is a web application that calculates mechanical properties from stress-strain curves of soft tissue, multiple input files can be uploaded and a results summary table (.csv) and report summary document (.pdf) may be exported by the user. A video tutorial is available on YouTube.
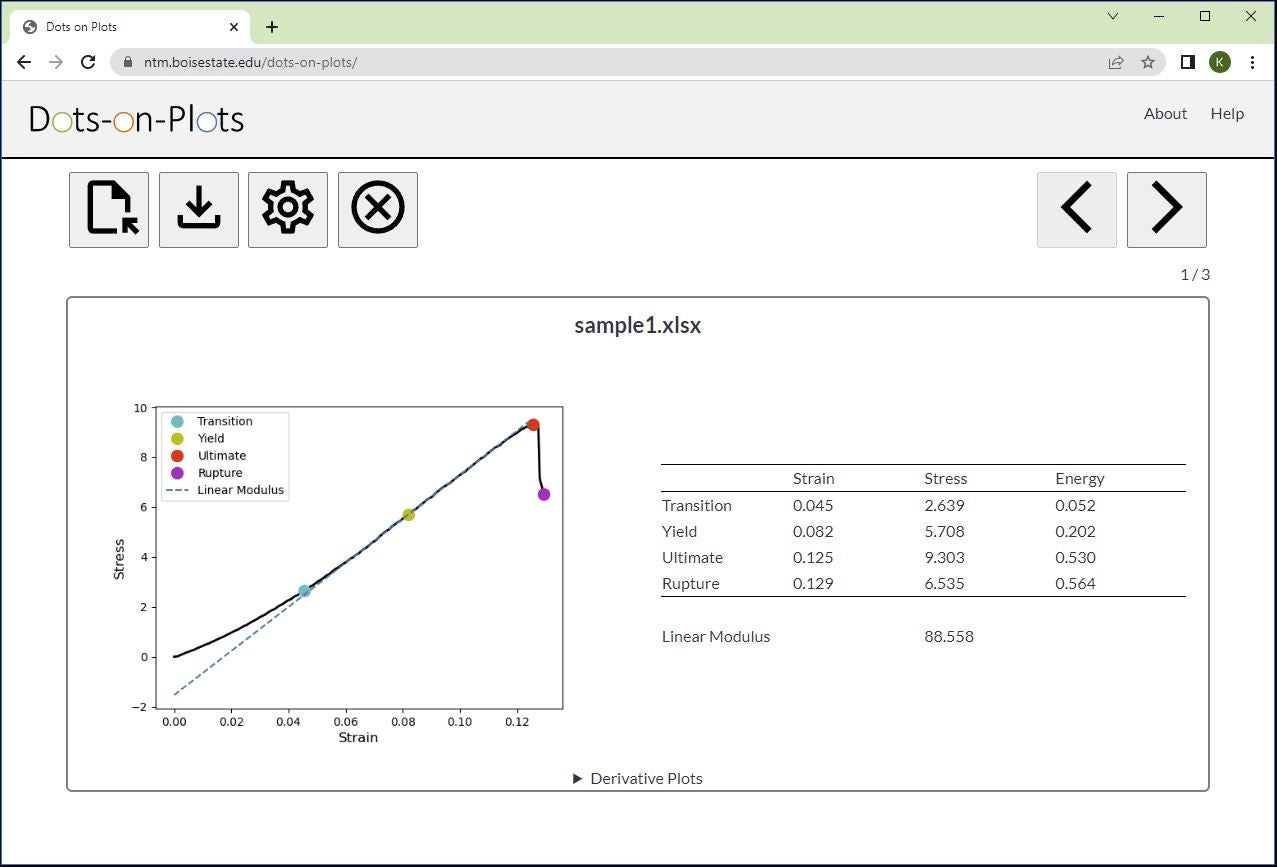
File Requirements: Acceptable file types for input are .csv, .xls, and .txt. Data must consist of two equal length columns of numbers. One header row with strings can be included in the input file. The first column of data will be plotted on the x-axis as strain. The second column of data will be plotted on the y-axis as stress.
Publication: For additional information on the development of Dots-on-Plots, including accuracy data and settings recommendations, please see our publication in the Journal of Biomechanical Engineering, “Dots-on-Plots: A Web Application to Analyze Stress-Strain Curves From Tensile Tests of Soft Tissue“. If you use Dots-on-Plots in your research, please cite this publication!
Getting Started
Go to the free Dots-on-Plots web application.
Check out our video tutorial for Dots-on-Plots.
Browser Requirements
In order to run Dots-on-Plots the user must use an updated version of either Google Chrome, Firefox, or Safari.
Source Code
If you’re interested in accessing the original Python source code used to help develop Dots-on-Plots, you can download on GitHub.
Support
If you have any questions or would like to report any bugs, please contact trevorlujan@boisestate.edu