

Dr. Burkhart specializes in research on explanatory factors of cross-national democratization patterns, Canada-US borderlands and environmental policy, and political culture. He earned his Ph.D. from the University of Iowa and has been a visiting professor at the Norwegian Technical and National University in Trondheim, Norway. Dr. Burkhart’s book Turmoil in American Public Policy: Science, Democracy, and the Environment, was published by Praeger Press (2010). His research has also been published in several peer-reviewed journals, including American Political Science Review, American Review of Canadian Studies, European Journal of Political Research, Journal of Borderlands Studies, Journal of Politics, Social Science Journal, and Social Science Quarterly.
The French presidential election is a unique event in Western democracies. It takes place in two rounds, beginning this year on April 23rd with the first round of voting between 11 candidates across the ideological spectrum, and concluding on May 7th with the second round of voting between the top two vote-getters in the first round (assuming no candidate receives a majority during the first round). The large number of candidates and the two-step process may make prognostication seem like a risky proposition. However, using forecasting techniques long-perfected by political scientists, I am able to make a prediction about how the French presidential election will turn out.
While the French election process is unique, France does share a similar ideological tendency across industrialized democracies toward populism, with a particularly stern test of the populist appeal this election. Many election observers expect that the candidate most identified with populism, Marine Le Pen of the extreme right-wing National Front, will advance to the second round of voting with the largest vote share. There is some question as to who is most likely to join her in the second round, with opinion polling split between several candidates; most notably, the centrist Emmanuel Macron, traditional conservative François Fillon, communist Jean-Luc Mélenchon, and socialist Benoît Hamon, with Macron the pundit’s favorite to advance and Mélenchon closing fast on Fillon just behind Macron. As for the second round, the smart money, according to the Hypermind Prediction Market, appears to be that either Macron or Fillon would defeat Le Pen, with Macron a much stronger bet to triumph than Fillon, and a Mélenchon-Le Pen matchup would be a toss-up.
These are the conventional expectations, but how justified are they given our expanding knowledge of French elections over the era of the Fifth Republic to today? Books such as Choosing the Chief: Presidential Elections in France and the United States, How France Votes, and French Presidential Elections have deepened our understanding of the importance the French people place on these elections as a referendum on government performance (voter turnout averages around 80% of registered voters) as well as the campaign strategies employed by candidates across the ideological spectrum to take advantage of any vulnerabilities in the government as it seeks another mandate. In this article, I put forth forecasting models for both rounds of the vote that draw on this deeper knowledge. Briefly put, the model results tell us that the vanquishing of the incumbent Left wing seems inevitable in the first round, and the prospects for the Center versus the Extreme Right seem relatively promising, though not entirely assured.
ELECTION FORECASTING 101

Nate Silver of FiveThirtyEight.com recently spoke at Boise’s Treefort Festival. He discussed local partisanship with Boise Mayor David Bieter, played a round of wonky political trivia and answered audience questions.
Click here listen to a podcast of the presentation.
To provide some context on this exercise, one of the more recent popular pastimes in political science is to forecast election results using mathematical equations and data. Since the 1980s, scholars have produced more than 200 of these types of forecasts, covering all areas of the democratic globe. (Please see this encyclopedia entry listing many of these forecasts.) These efforts have become famous, with forecasters being frequent interview targets of traditional media leading up to the elections while also gaining many followers in social media anxious to “know” the likely outcome prior to Election Day. A prominent speaker at the recently-concluded Treefort festival in Boise was Nate Silver, founder and editor in chief of FiveThirtyEight, a data-driven news website. Silver gained his fame from correctly forecasting the result of the 2008 and 2012 presidential elections, and along with nearly all other forecasters the popular vote in the 2016 presidential election.
Commonly, election forecasters put forth a statistical model that attempts to capture the most important factors that yield a prediction of the final vote coming as close to the actual result as possible. This is a different endeavor from a theoretical explanation of political behavior, or “why” something happens. Rather, forecasters seek answers to the question of “what” predicts some behavior of interest happening. Election forecasters wish to provide their forecasts with nontrivial lead time, months prior to the election if possible—one successful model of U.S. presidential elections issued its forecast more than ten months in advance of the elections. (Not all forecasters use statistics: Allan Lichtman of American University places presidential candidates into “key” categories and then makes a forecast called Keys to the White House. He notably forecasted Donald Trump’s victory in 2016.)
Michael Lewis-Beck and Ruth Dassonneville identify in a 2015 Electoral Studies article three types of forecasting models: structural mathematical equations, aggregations of polls (such as the Huffington Post forecasting tool), and a mixture of the two called synthetic (FiveThirtyEight). Of these categories, structural equation models provide an easy to interpret, early-bird, better-than-rough estimate of a forecast of one of the trickier countries to forecast on account of its two-stage electoral process: France.

FORECASTING THE FRENCH ELECTIONS
A prominent structural model was put forth by Richard Nadeau, Michael Lewis-Beck, and Éric Bélanger in an article in French Politics (subscription required) ahead of the 2012 presidential elections. The model forecasted the first-round vote received by all of the presidential candidates recognized as being on the left of the ideological spectrum. As an independent variable, the popularity of the French president six months prior to the elections is used as a measurement of how well the voters perceive the government to be doing its job, in a reward-and-punish decision process. The model was remarkably good at making forecasts through 2012, with 90% percentage of variation in vote explained, and a prediction error of around 2.5 percent. Given this model’s accuracy in previous elections, and since the authors are not using the model to forecast this year’s election, it seems worth the effort to revive it for the 2017 elections.
The model works by making predictions about the percentage of voters supporting the Left parties based upon the voters’ support of the government, and then comparing those forecasts to the actual result. Since the forecasted result is never precisely the actual result, these predictions undergo a mathematical process called least-squares regression that reduces to the lowest amount possible the error between the forecasted result and the actual result. The equation can be pictured as a straight line running through the data points on a graph with an X-axis and a Y-axis where the line comes as close to the vote and government approval data points as possible. The equation line will look like this:
Forecasted Round 1 Left Vote = Y-Intercept + (Slope x Incumbent Party Popularity)
To make our 2017 forecast, we need to know the slope of the line and where the line crosses the Y-axis, called the Y-intercept. In our equation, the Y-intercept is 3.798 and our slope is .767. We insert those values in our equation and come up with:
Forecasted Round 1 Left Vote = 3.798+ (.767 x Incumbent Party Popularity)
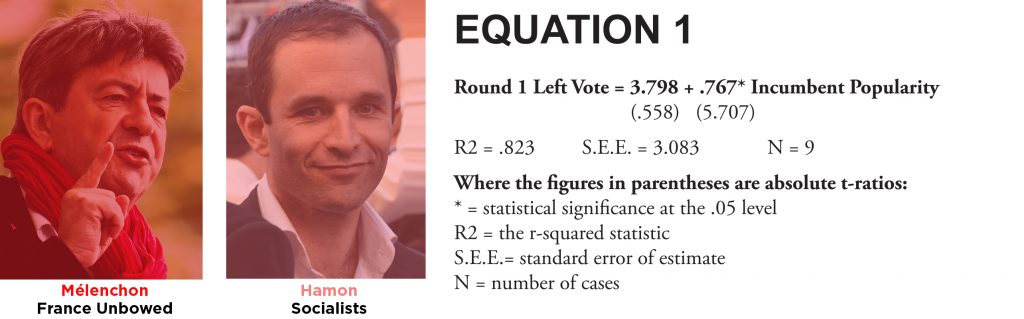
(.558) (5.707)
R2=.823 S.E.E = 3.083 N=9
Where the figures in paratheses are absolute t-ratios:
*=statistical significance at the .05 level
R2=the r-squared statistic
S.E.E=standard error of estimate
N=number of cases
All that remains to do is to plug the November 2016 popularity of President François Hollande into the equation to obtain a Left Vote first-round election estimate. Since Hollande’s popularity was a historically low 4% as measured by CEVIPOF, the forecast for the left vote is a paltry 3.798 + (.767 x 4.0) = 6.86 percent of the vote.
This forecast is certainly on the lower end of expectations for how the left candidates will do in the election based on current polling, which has them acquiring 20-25% of the first-round vote. However, according to Michael Lewis-Beck’s 1988 extensive voting study Economics and Elections, French voters are known to be motivated by anger in their vote choices. This year seems to be an exceptionally turbid year on both sides of the Atlantic, so it is highly plausible that the incumbent party in power, the Socialists, will be cast out of the Élysée Palace in angry and emphatic fashion.
What of the second round of voting? This is much harder to forecast using this type of modeling, since there is only a two-week period between the first and second rounds. Assuming that the top two candidates will be Macron, a self-styled centrist who would be closest to disaffected Left voters, and either Le Pen or Fillon from the Right, we can construct a simple “prior performance” forecasting model. Perhaps the most useful proxy of the second round is the result of the first round, again using the ideological Right and Left designation. The correlation between the first and second round votes for Left candidates from 1965-2012 is .89, and for Right candidates it is .77. Given the high correlations, and the prediction that the Left will not make it to the second round, we can construct a forecast using the same least-squares regression procedure outlined previously that results in the following equation:
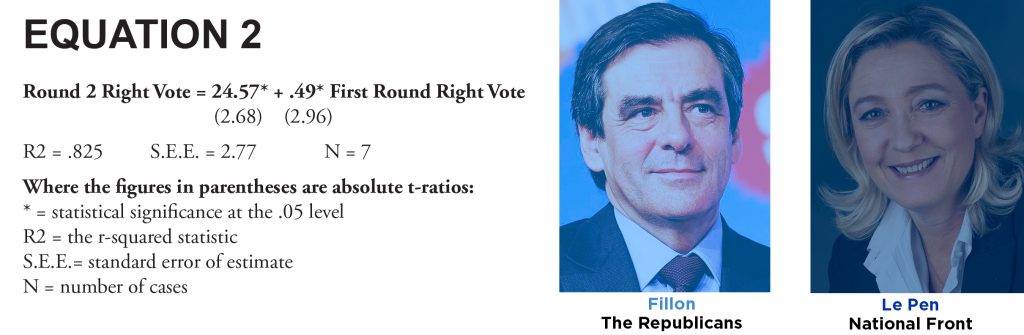
(2.67) (2.96)
R2=.825 S.E.E = 2.77 N=7
Where the figures in paratheses are absolute t-ratios:
*=statistical significance at the .05 level
R2=the r-squared statistic
S.E.E=standard error of estimate
N=number of cases
As of April 10th, the polls have the first round Right vote at 48.0. Plugging that value into the equation, the Right vote for the second round is forecast to be 48.09, or just short of the majority needed to win in a two-person runoff. The winner, in this case, would be either the centrist Macron or, less likely, the communist Mélenchon. But what if the final two turn out to be Fillon and Le Pen? In this case, the model cannot forecast a winner. As always, it will be up to l’électeur Français to « décide ».
Editor’s note – check back after the conclusion of the election for an update on how these models performed.