A Look at the Latest Success, Award and Funding Rates…and More
We frequently talk about the different ways of analyzing NIH funding. Let’s revisit this topic so I can provide you with the latest numbers. As a reminder,
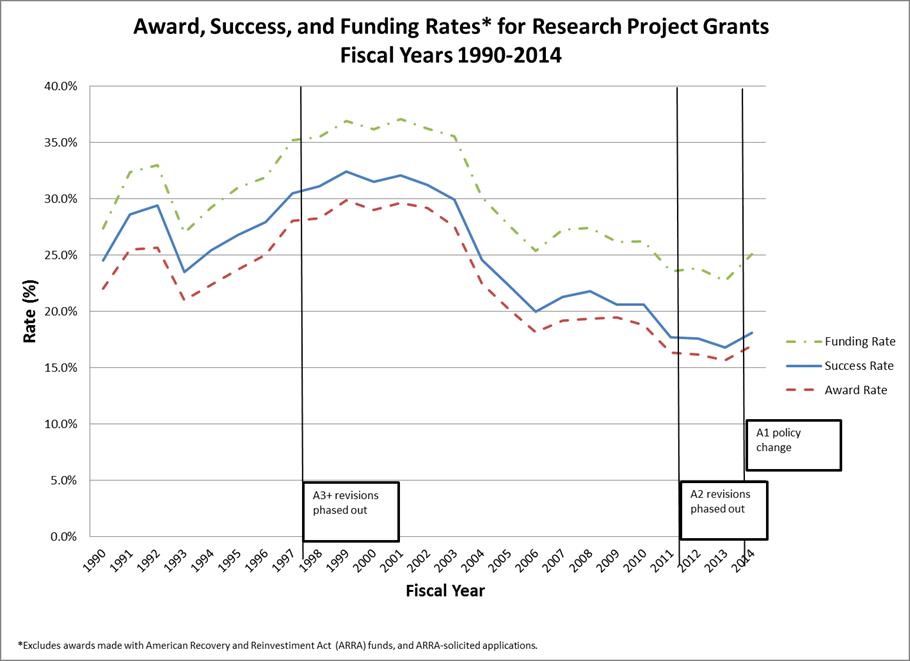
- Success rate describes the likelihood of a project or an idea getting funded, rather than of the success of the individual application submission.

- Award rate describes the chance of an individual application being funded and is the number that more closely reflects institute and center paylines (which can vary significantly from one institute or center to another).

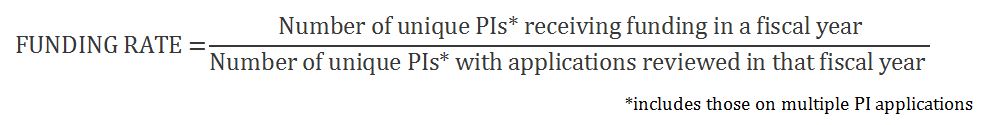
- Funding rate reflects the number of investigators who seek and obtain funding. Each principal investigator (PI)* is counted once, whether they submit one or more applications or receive one or more awards in a fiscal year.
Now let’s look at the latest data for NIH as a whole. The chart below shows modest upward trends for fiscal year (FY) 2014 compared to 2013. NIH received 51,073 research project grant (RPG) applications, out of which we funded 9,241, resulting in a success rate of 18.1 percent. When we look at award rate, which accounts for re-submissions that came in during the same fiscal year, the application count increases to 54,519 resulting in an award rate of 17.0 percent in 2014. And if we look specifically at numbers of PIs, we see that in FY 2014 we funded 9,986 PIs out of 39,809 total investigator applicants for a funding rate of 25.1 percent.