By Jenna Farmer
Abstract
We aimed to determine the effects of nutrient availability on the growth rate and carrying capacity of Lemna minor. To test this, we created twenty-one replicas of four different nutrient level systems: none, low, medium, and high. Over the course of five weeks, the thalli of the plants were counted and the weekly growth rate was determined. At the end of the five weeks, carrying capacity and overall growth rate of each system were estimated. By running ANOVA tests on the nutrient levels versus carrying capacity and nutrient levels versus growth rate, we were able to conclude that nutrient availability did cause a difference in growth rate and carrying capacity. Out of the four systems, the medium nutrient level showed the highest weekly growth rate and the highest carrying capacity. Our high nutrient level system showed a negative growth rate and the lowest carrying capacity. The none and low nutrient levels showed results in between the medium and high treatments. We concluded that as nutrient levels increase, growth rate and carrying capacity increase to a certain extent.
Introduction
Lemna minor, or duckweed, is a small, free floating, aquatic plant capable of living in standing or slow moving water. Duckweed can reproduce sexually through seeding, although this type of reproduction is rare. The majority of the time Duckweed reproduces asexually through budding (How Does Duckweed Reproduce). Spread and dispersion of this plant is often attributed to waterfowl hence the common name duckweed. In fact, Lemna plants have been found on ducks traveling between lakes on multiple occasions (Jacobs 1947). Duckweed’s optimal temperature ranges from sixty degrees Fahrenheit to ninety degrees Fahrenheit. The plant is often found in more acidic waters ranging from a pH of four to eight. Due to the plant’s hardiness and exponential growth rate, it is often regarded as a pest (Lemna Minor).
Although often seen as a pest due to its size, growth rate, and competitive abilities, duckweed has many valuable applications. According to the International Lemna Association, duckweed can be used in the making of a multitude of products including livestock feed, fertilizer, fish food for use in fisheries, bioplastics, and bio fuel. In addition to the cultivation of these products, duckweed can also be used for genetic research in wastewater treatment systems from both farming productions and human waste. Currently, duckweed is being grown and used as a cleansing technique in livestock and agricultural waste, where it is then harvested and fed to production animals as a nutrient rich food (International Lemna Association). Optimizing the growth of Lemna plants can provide more efficient food for livestock, in turn producing more food for humans. With an increasing world population, utilizing more sustainable food practices is more important now than ever.
In the lab at Boise State University, we worked to understand if and how nutrient availably played a role on the growth rate and carrying capacity of Lemna minor, a common species of the Lemna genius. By understanding how nutrient availability affects growth rate and carrying capacity, we can determine the optimum growth conditions for Lemna plants. By growing the plant at optimum conditions, we can maximize production. Seeing as Lemna minor is becoming more widely used throughout the world for important purposes, such as livestock food production, maximizing production of Lemna minor could create more a more efficient system and ultimately increase global food production.
When starting this experiment, we hypothesized that systems with more nutrient availability would have an increased weekly growth rate and the high nutrient system would show the greatest growth rate. We also predicted that carrying capacity would be lowest in the no nutrient treatment but equal in the other three treatments.
Methods
To conduct this experiment, we used four nutrient levels. First we used 150 milliliters (mL) of a control with multiple minerals dissolved in it to simulate artificial pond water (Table 6). Second we used 150 mL of a low nutrient level which was the medium broth diluted to twenty percent the concentration (Table 5). Next we used 150 mL of a medium nutrient broth containing multiple nutrients dissolved in it (Table 5). Table 5 shows the exact nutrients and the concentration level of each that were used. Lastly, we used 150 mL of a high nutrient broth containing twenty times the concentration of nutrients as the medium nutrient level (Table 5). We obtained twelve-ounce plastic cups, covered them with plastic wrap, cut holes in the plastic wrap, and rubber banded the wrap in place. These cups simulated the different ecosystems for the nutrient levels. Each group had 1 cup filled with each nutrient level, totaling four cups per group. Then, fifteen plants were added to each cup. A plant was defined as one freestanding bundle of anything between one thallus and four thalli. A thallus was defined as a single leaf of a plant.
After fifteen plants were added to each treatment cup, they were placed under fluorescent grow lamps to allow adequate growth over five weeks. On a weekly basis, the cups were removed from the grow lights for approximately thirty minutes to be analyzed. Thalli were counted to calculate weekly growth rate. Both healthy, growing, green thalli and less healthy white thalli were counted. Brown, unhealthy, and dead thalli were not counted. Each treatment was allowed to grow under the fluorescent grow lights for a total of five weeks. After these five weeks, the final thalli count was gathered and the plants were disposed of. Between the three lab sections, there were 21 groups in total that provided data for use. Once all twenty-one groups gave their data, the numbers were averaged and statistical analysis was performed.
With the weekly thalli counts, we calculated the weekly growth rate and the carrying capacity of the system. To determine growth rate, we plotted the natural log of the thalli number, plus one versus time. We then fit a regression line to that plotted data and used the slope of that line as our weekly growth rate (λ) for each treatment. To calculate carrying capacity (K), we plotted growth rate verses time and set the y-intercept to the highest growth rate of each treatment. We then determined the x-intercept of that regression line, or the point at which growth equaled zero, and used that value as our carrying capacity.
We then performed statistical analysis using Microsoft Office Excel 2016. To compare the data, we used ANOVA tests which determine if there was statistical evidence to suggest a difference between treatments. One ANOVA test was performed comparing the different nutrient levels (none, low, medium, and high) and growth rate of each system to see if there was a significant difference in growth rate between the treatments. A second ANOVA test was performed comparing nutrient levels, (none, low, medium, and high) and the carrying capacity of each system (K) to determine if there was a significant difference in carrying capacity between the nutrient levels.
Results
The systems increased in growth rate and carrying capacity as the nutrients increased through the medium treatment. The high system showed the lowest growth rate of -0.064 thalli per week (Table 1) and the lowest carrying capacity of 345.571 thalli (Table 2). The ANOVA test comparing nutrient treatments with growth rate showed strong statistical evidence that nutrient level does affect growth rate (F3, 80 =53.27, p=5.03 X 10⁻¹⁹). The second ANOVA test performed comparing nutrient treatments with carrying capacity also showed that there is enough statistical evidence to conclude that growth rate has an effect on carrying capacity (F3, 80 =6.31, p=0.00068). Both of the above p values are well below our designated alpha value of 0.05. Because of this, we conclude that the nutrient availability does have an effect on both growth rate and carrying capacity.
We can see that as nutrient levels increase, our growth rate increases until our high treatment level (Figure 1). Likewise, as nutrient levels increase, our carrying capacity increases until our high nutrient level treatment (Figure 2). The medium nutrient level depicted both the highest growth rate, 0.368 thalli per week and carrying capacity, 801.4 thalli across all four systems (Table 1, Table 2). In contrast, the high nutrient level showed the lowest growth rate, – 0.064 and carrying capacity 345.6 across the systems (Table 1, Table 2).
Discussion
We have determined that there is an effect of nutrient availability on growth rate and carrying capacity. Looking at growth rate, we can see that as nutrient availability progresses, so does growth rate up until the high nutrient level (Figure 1). The medium nutrient treatment had the highest weekly growth rate. In treatments excluding high nutrient levels, the growth rate was directly proportional to nutrient availability, increasing as nutrient availability increased (Figure 1). In 1999, it was determined that UVB radiation caused an increase in growth rate if, and only if, the plants have enough nutrients to sustain growth (Germ et al. 1999). Plant growth was only observed when there were adequate nutrient levels. This provides further evidence that the amount of growth is directly correlated to the amount of available nutrients.
Looking at carrying capacity, we know that Lemna minor is commonly referred to as a hardy plant. In 1976, through an experiment with multiple species of Lemna, Keddy concluded that Lemna minor was the most competitive and had the highest fitness of all Lemna species (Keddy 1976). This competitiveness could shed light on why the carrying capacity increased with nutrient availability. For a plant to be competitive among others like itself, it has to be able to process and take up nutrients. This ability to take up nutrients is likely a determining factor of why carrying capacity was increasing with nutrients. Keddy also explained that at some point, a system of Lemna minor will reach equilibrium. Any time the population falls above this equilibrium point, the population declines. Keddy attributed this fall in population of Lemna minor to low water pH (Keddy 1976). Although Lemna minor can grow in a pH as low as four (Lemna Minor), a pH of six to eight is preferred (Tomkins 2016). The amount of nutrients in our high nutrient treatment could have caused a drop in pH of the water. This could be part of the reason of the slow growth rate and ultimately a lower carrying capacity for all replicas of the high treatments.
Earlier this year, it was determined that Lemna minor is out competed, and ultimately pushed to extinction in waters with too high of phosphate levels (Paolacci et. al 2016). This could lead to reasoning as to why our high nutrient level treatments failed at growing and increasing proportionally. Our high nutrient system may have simply contained too much phosphate for Lemna minor to thrive. In addition to the possibility of high phosphate levels, it has been determined that a heterogeneous mix of nutrients is preferred by Lemna minor over a homogenous mix of nutrients. Favorability was determined by comparing the carrying capacities of two systems (Zhang et. al 2015). With regards to this, our high nutrient system may have had a lower growth rate and carrying capacity due to the nutrient mix being too homogenous for the Lemna minor to thrive.
By conducting an experiment using four nutrient levels, we were able to conclude that nutrient availability does have an effect on the growth rate and carrying capacity of Lemna minor. We recorded a positive trend as the nutrient levels increase up until the high nutrient level. The high nutrient level system showed the lowest growth rate and carrying capacity. This could be due to the homogeneity of the system, a low pH of the water or excess phosphate in the system. Carrying capacity and growth rate were highest in the medium nutrient level suggesting a positive correlation between nutrient level and growth rate and carrying capacity to an extent. This experiment can shed light on the preferences of Lemna minor about its optimal growth conditions. We can conclude that after a certain nutrient richness, Lemna no longer thrives.
Knowing that Lemna cannot thrive in high nutrients can be beneficial when using the plant for waste water treatment. Mullins describes phosphorus as an essential nutrient for plant growth. However, when phosphorous is used too readily in agriculture productions, it can produce high phosphorous concentrations in waste water (Mullins 2009). As seen above, Lemna will not thrive in conditions with high levels of phosphorous. This suggests that Lemna minor will not show a high growth rate in raw agricultural waste containing high amounts of phosphorous. Such water is often found near fields utilizing high amount of artificial phosphorous fertilization. In such cases, Lemna minor may show a better growth rate and a higher overall yield when grown as a second cleansing technique in water with high phosphorous levels.
By continuing to learn about Lemna minor, we can maximize its growth rate in a more efficient manner. Ultimately, by optimizing Lemna’s growth conditions, we can, over time, maximize livestock feed production. When producing livestock feed in the most efficient way, we can increase the global food production which will be important for future uses when feeding the increasing population.
Literature Cited
Germ, M. and A. Gaberscik. 1999. The effect of UV-B radiation and nutrient availability on growth and photochemical efficiency of PSII in common duckweed. PHYTON-ANNALES REI BOTANICAE 39:187-191.
How Does Duckweed Reproduce?. 2016. http://www.gardenguides.com/88730-duckweedreproduce.html.
International Lemna Association. 2016. http://www.internationallemnaassociation.org/.
Jacobs, D. 1947. An Ecological Life-History of Spirodela Polyrhiza (Greater Duckweed) with Emphasis on the Turion Phase. Ecological Monographs 17:437-469.
Keddy, P. 1976. Lakes as Islands: The Distributional Ecology of Two Aquatic Plants, Lemna Minor L. and L. Trisulca L. Ecology 57:353-359.
Lemna Minor. 2016. http://www.aquaticplantcentral.com/forumapc/plantfinder/details.php?id=131.
Mullins, Gregory. Phosphorous, Agriculture and the Environment. 2009.
https://pubs.ext.vt.edu/424/424-029/424-029_pdf.pdf
Paolacci, S., S. Harrison, and M. Jansen. 2016. A comparative study of the nutrient responses of the invasive duckweed Lemna minuta, and the native, co-generic species Lemna minor. Aquatic Botany 134:47-53.
Tomkins, S. 2016. Growing duckweed – what nutrient level and pH level is recommended?. http://www.saps.org.uk/secondary/teaching-resources/365-what-nutrient-level-and-phlevel-is-recommended-for-growing-duckweed.
Zhang, B., X. Liu, D. DeAngelis, W. Ni, and G. Wang. 2015. Effects of dispersal on total biomass in a patchy, heterogeneous system: Analysis and experiment. Mathematical Biosciences
264:54-62.
Figures and Tables
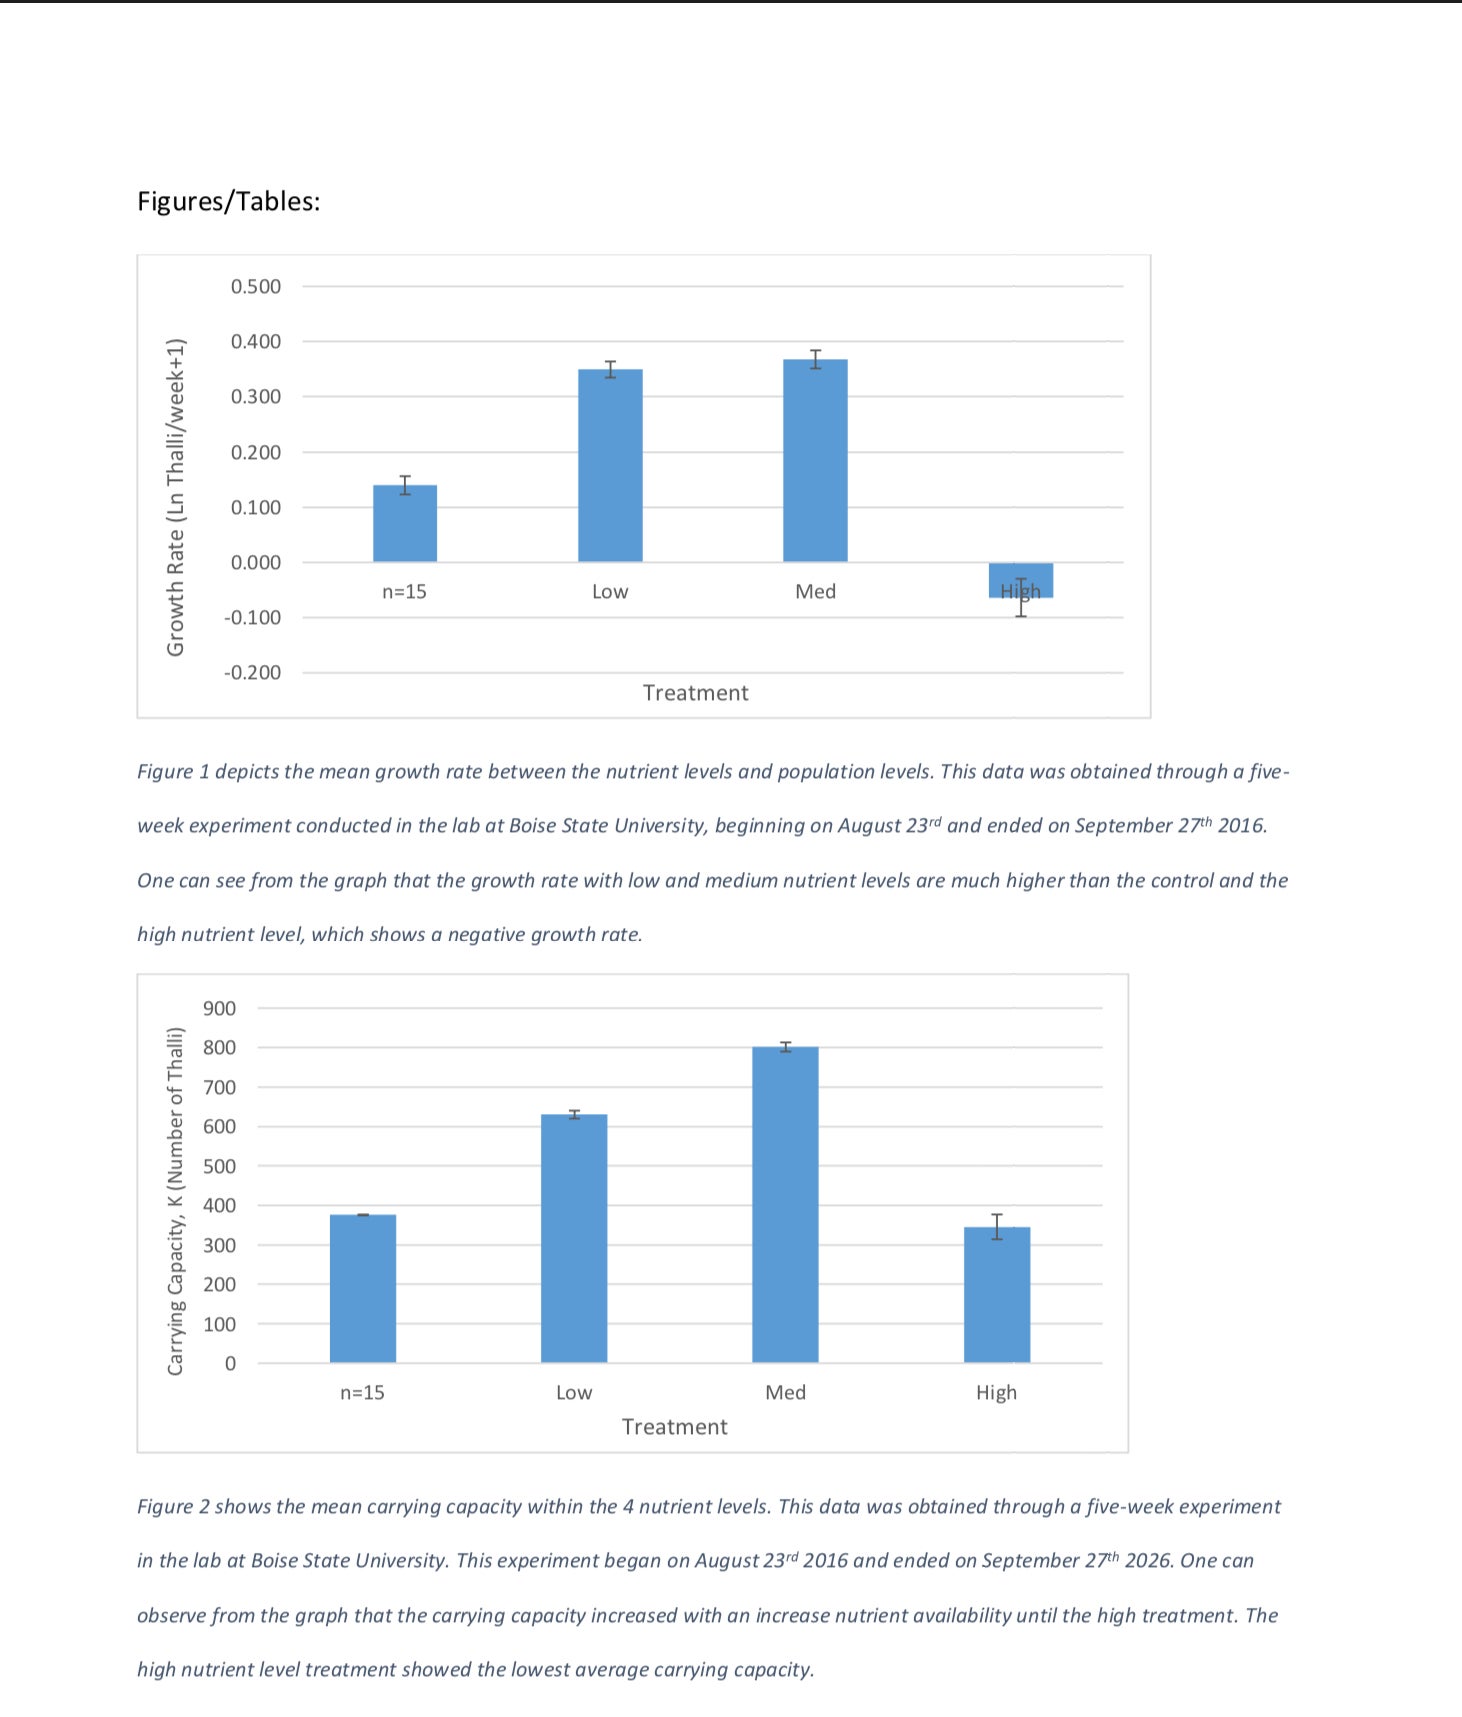
Figure 2 shows the mean carrying capacity within the 4 nutrient levels. This data was obtained through a five-week experiment in the lab at Boise State University. This experiment began on August 23rd 2016 and ended on September 27th 2026. One can observe from the graph that the carrying capacity increased with an increase nutrient availability until the high treatment. The high nutrient level treatment showed the lowest average carrying capacity.
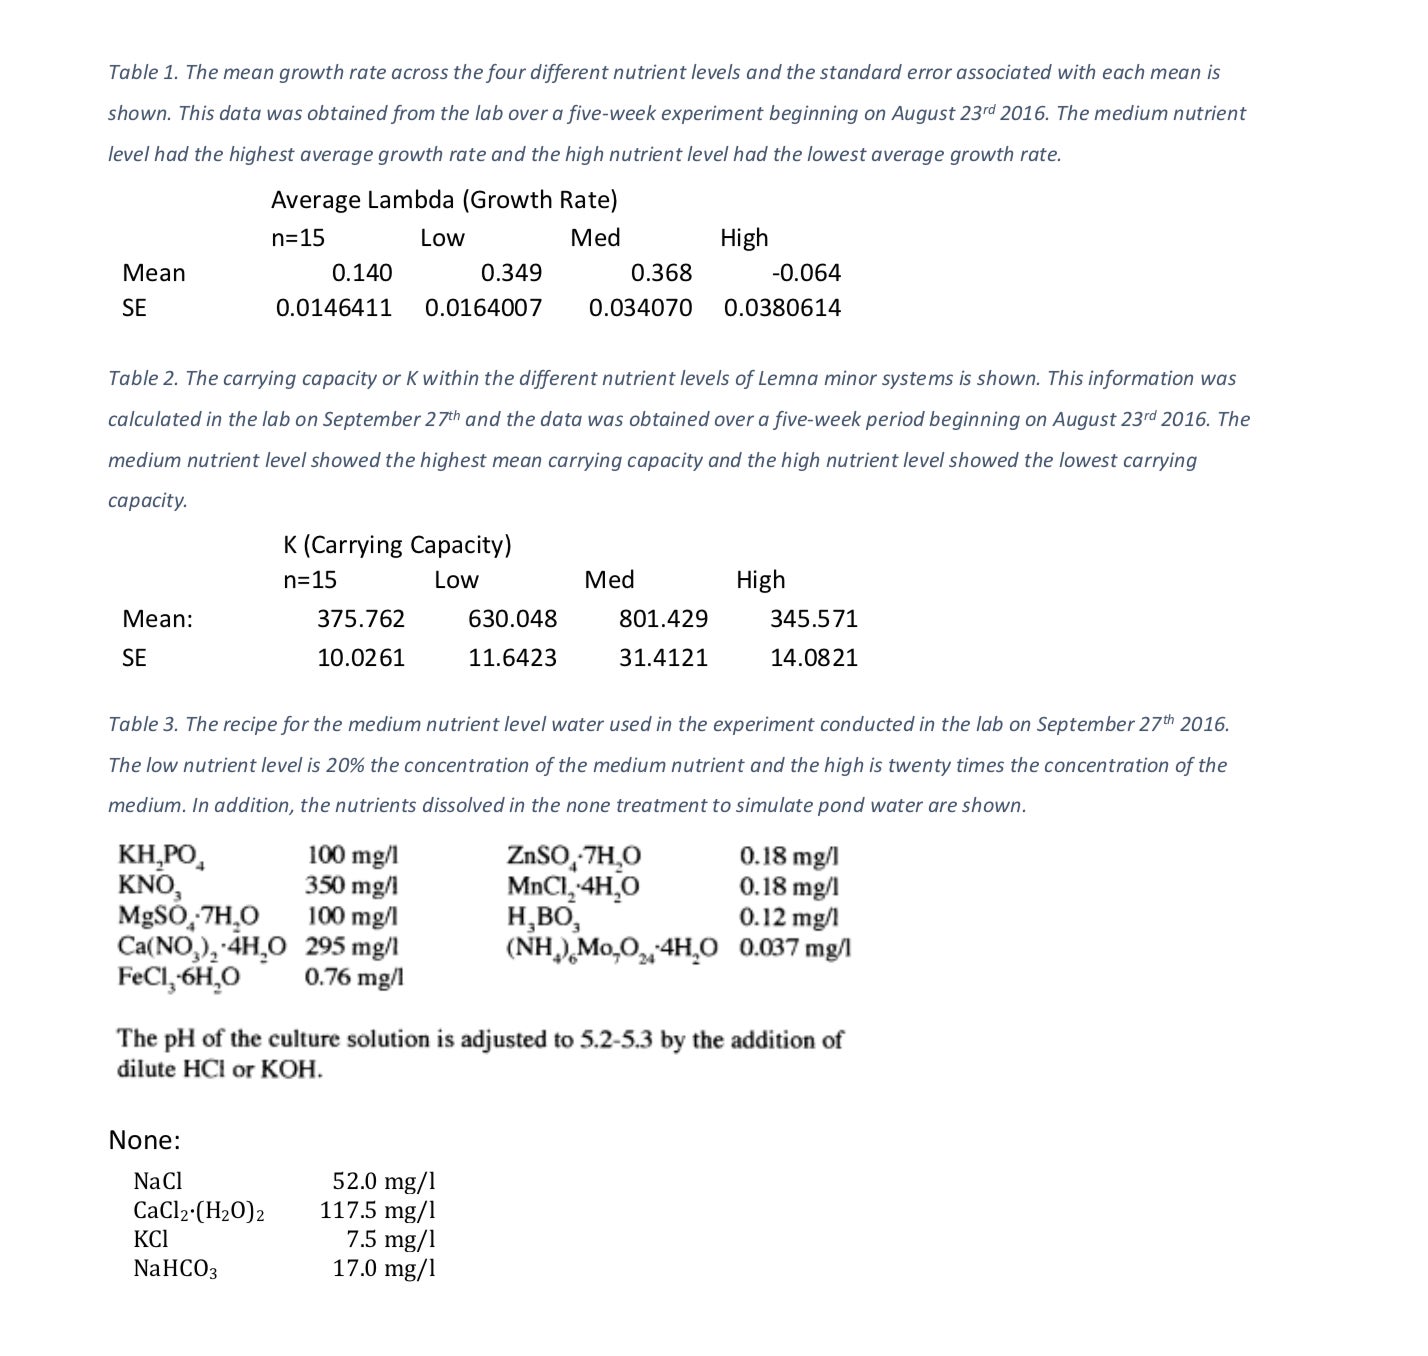
Table 2. The carrying capacity or K within the different nutrient levels of Lemna minor systems is shown. This information was calculated in the lab on September 27th and the data was obtained over a five-week period beginning on August 23rd 2016. The medium nutrient level showed the highest mean carrying capacity and the high nutrient level showed the lowest carrying capacity.
Table 3. The recipe for the medium nutrient level water used in the experiment conducted in the lab on September 27th 2016. The low nutrient level is 20% the concentration of the medium nutrient and the high is twenty times the concentration of the medium. In addition, the nutrients dissolved in the none treatment to simulate pond water are shown.