By Kate Benfield
Abstract
The internship program for the College of Engineering allows students to conduct research in a laboratory of their interest. Under the mentorship of Dr. Trevor Lujan, an internship project was completed within the Northwest Tissue Mechanics laboratory over the course of the Fall 2018 semester. The internship work focused on three primary learning objectives in association with an overall project objective: to develop and validate a methodology to measure the volume loss of bovine meniscus using a 3D optical scanner. An open sourced software, CloudCompare, was identified as a suitable program to computationally evaluate volume loss. A process was created to analyze volumetric wear utilizing a block model as a surrogate for a bovine meniscus. The methodology was validated by the block model with an error of less than 5% between real-life measured volume and CloudCompare calculated volume. The learning objectives of this internship were met, and the methodology developed will prove to benefit the Northwest Tissue Mechanics laboratory.
1. Introduction
1.1 Internship
The College of Engineering at Boise State University offers internships for students to conduct research within faculty laboratories. These internships allow for students to apply classroom-based knowledge and understanding to research endeavors. The goal of the internship program is for students to be able to independently work towards achieving a research project objective while advancing engineering and technical skillsets. This Fall 2018, a select number of students were chosen to work in the biomedical laboratories. The author of this report was selected to conduct research within the Northwest Tissue Mechanics laboratory under his mentorship and advisorship.
For this semester, the author’s internship stemmed from a continuation project of a graduate student proposed study on meniscus degeneration. The primary objective of the project was to develop and validate a methodology to measure the volume loss of bovine meniscus in relation to wear using a 3D optical scanner. To prepare and to conduct this research, learning objectives were assigned prior to the start of the internship. Learning objectives needed to align well with the goals of the internship program. Such goals needed to allow for the intern to improve upon complex problem-solving skills in addition to fostering an environment for learning and understanding. Three overarching initial learning objectives were made to further advance research and hands-on-learning: (1) Gain a strong understanding of 3D optical scanning and accompanying software, (2) Learn how to design and conduct experiments independently to verify procedures, (3) Gain experience in technical communication and documentation. These learning objectives were to be achieved over the course of the semester by referencing journal articles, applying known knowledge to solve problems, working alongside laboratory staff, and by attending weekly meetings with advisor.
1.2 Meniscus
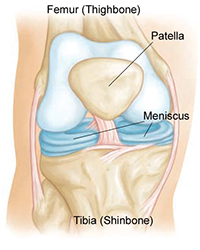
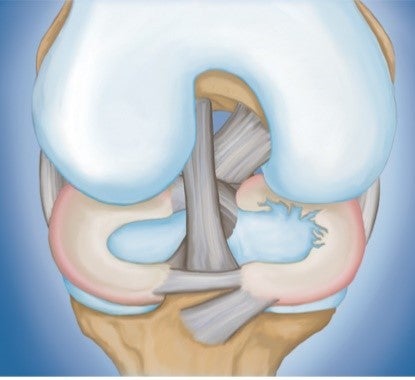
A meniscus is a fibrocartilaginous soft tissue that is located between the femur and tibia (Fig. 1) [1]. There are two menisci: the medial meniscus and the lateral meniscus. Both function within the knee to provide stability and to protect the articular cartilage of the knee joint [1]. The menisci act to absorb applied compression and tension forces to the knee as a result of daily activity. Over time, menisci degenerate as a result of overuse and mechanical wear leading to tears within the tissue (Fig. 2). Meniscus degeneration is defined as a retrogressive pathological breakdown of meniscal fibrous tissue which, more often than not, results in increased knee pain [2]. This degeneration is of high prevalence with over 56% of individuals above the age of 70 years impacted [3]. As meniscal tissues continue to breakdown, the load bearing capacity of the menisci are ultimately affected. The microstructural damage to a meniscus can lead to the development of osteoarthritis (OA) [1]. The menisci are mostly avascular, meaning they lack a blood supply within the tissue. This avascularity contributes to the limited ability for meniscal tissue to heal naturally [1]. Degenerative meniscus tears are therefore commonly treated through a procedure called a meniscectomy, the partial or full removal of a damaged meniscus. While this treatment helps to alleviate pain brought on by the occurrence of degeneration, it can ultimately lead to increased wear rates, shear-induced bone fracture, and further joint and chronic meniscal degeneration [2]. It is of high prevalence to further research the impact of wear on meniscus degeneration to prevent and treat alignments related to degeneration. The objective of this research is to therefore develop a process for characterizing volumetric wear behavior within a meniscus.
2. Methodology
2.1 Overview
3D optical scanning has the potential to be used in place of current wear analysis techniques such as gravimetric and magnetic resonance imaging (MRI) analyzes. The advantages to using 3D optical scanning have been proven in [4] to be fast, reliable, and capable of detecting small surface irregularities. A 3D optical scanning technique was adopted from Hollar et. al. [4] to digitally scan images of bovine meniscus. The scanner used within this research was verified to have an accuracy of 2.1um as shown in [4]. To address the internship project objective, the scanning technique was utilized in conjunction with a developed methodology to further assess volumetric wear.
2.2 Familiarization with 3D Optical Scanning and Accompanying Software
In accordance to the first learning objective of the internship, 3D scanning techniques and software needed to be understood prior to experimentation. To fully understand the concept of 3D optical scanning and the accompanying software, FlexScan 3D, initial research was conducted through a literary analysis of the scanner’s user guide. Notes were recorded in a journal to help address the setup of the scanner and FlexScan 3D. Once the user guide had been read, in-laboratory tutorials were followed to complete the steps of calibrating the scanner, scanning an object, aligning scans, and finalizing the images. Multiple test trial scans were taken of a cubed object to further familiarize and become comfortable with the scanning process. In person assistance from mentor was offered and accepted when needed. Mentor proved to be an excellent and knowledgeable reference when operating the scanning software.
The overall learning process for scanning took approximately three weeks to complete. During this time, it was determined that the processing speed and memory of the computer used for scanning was hindering the scanning and processing of the scanned images. The time required to scan and process a total of 6 scans of one object took approximately 30 ± 5 minutes. It was estimated from [4] that 11 or more scans of an object would be needed for an accurate complete scan. Due to the increased scanning time, it was important to try and decrease this time to optimize the procedure. College of Engineering IT, was contacted regarding the issue. He served as a reference for increasing the processing power of the computer. The original computer was ultimately switched with another computer in the laboratory to help increase speed of scanning and processing. With this improvement to the processing speed, it now takes 4 ± 1 minutes to completely process a set of 6 scans therefore greatly reducing the time spent waiting for images to process and render.
2.2 Tasks
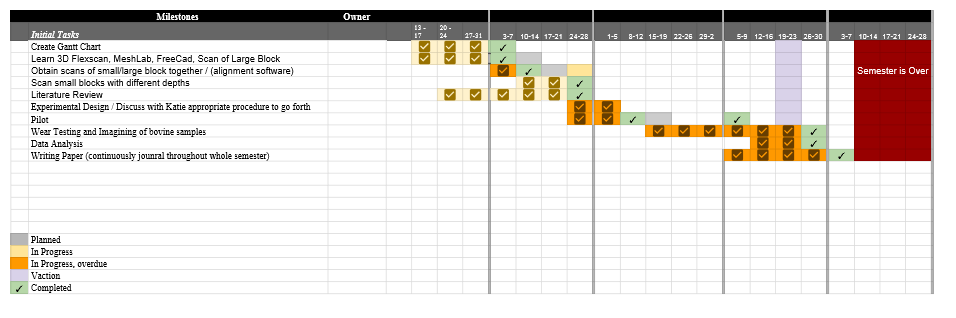
Once adequate knowledge of the 3D scanner and FlexScan 3D software had been acquired, an experimental design and testing schedule was created. A timeline for the semester was generated via a Gantt chart to help prioritize certain features of the experiment. This chart is shown in the attached appendices. To address the overall project objective, four tasks needed to be done in order to advance previous investigation into 3D optical scanning involving meniscus wear. The tasks are as follows: (1) Determine software capable of analyzing volumetric wear and subtracting common geometries between multiple scans, (2) Verify accuracy of scanning process and found software with non-defect reference blocks (3) Analyze a reference block surrogate model for meniscus wear, (4) Validate the methodology using bovine meniscus.
2.2.1 Experimental Design
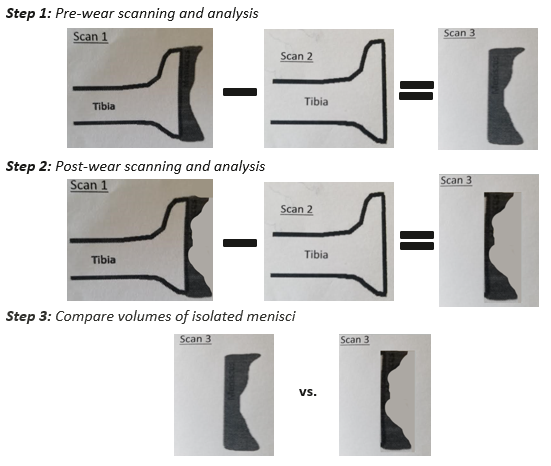
As an overview of the experimental design, figure 3 addresses the goal for experimentation. As shown in steps 2 and 3, the first 3D scan is of the tibia and the meniscus together. The second scan, the tibia only, is subtracted from the first scan using common geometry subtraction. Scan 3 then shows the isolated meniscus either pre- or post-wear. The volumes of the isolated menisci are compared to analyze the overall volumetric loss acquired from wear. As stated in task 3 of the experimental design, a surrogate meniscus and tibia model using reference blocks was to be used in the process outlined in figure 3. This was to be done in order to gain an understanding of how the methodology would work and to verify the accuracy of software identified from task 1. Once tasks 1, 2, and 3 were complete, a volumetric wear analysis of bovine meniscus was to be conducted utilizing the experimental design concept (Fig. 3).
2.2.2 Identification of Appropriate Software
As identified in the experimental design tasks, task 1 required the determination of a software program capable of analyzing volume and subtracting common geometry. Many programs were found that could calculate the volume of a finalized 3D scan; however, a limited number were capable of preforming common geometry subtraction. Programs such as Geomagic for SolidWorks and Polygonica were suitable options for software but acquiring licensing for them proved to be unconducive for this internship. In addition, the program Meshmixer was an option suitable for common geometry subtraction; however, it was incapable of aligning and subtracting irregular geometries. After consulting a series of online forums regarding aligning and subtracting software, a program called CloudCompare was found.
CloudCompare is an open source software that is available for a wide variety of uses. It provides a basic set of tools for manually editing and rendering 3D scanned images. It is capable of aligning multiple processed images together as meshes – a collection of vertices and faces that are stitched together to for a 3D graphic used for modeling. CloudCompare is also capable of utilizing common geometry subtraction which is pertinent to this research. After the identification of CloudCompare, the software needed to be learned in order to advance research. The program took approximately two weeks to learn completely.
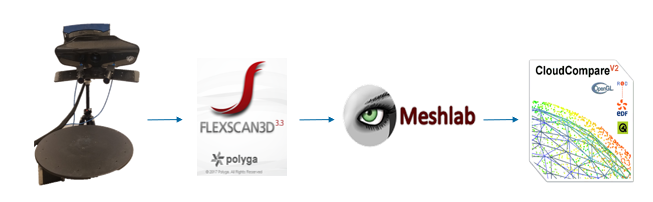
2.3 Software
The complete process from the 3D optical scanner to volumetric analysis utilized three different software platforms. FlexScan 3D was used to control a projector and two high-resolution cameras in order to acquire scans of the object of interest. In addition, FlexScan 3D processed, aligned, combined, and finalized sets of scanned images. The program Meshlab was used to create a mesh from the processed scan images. CloudCompare was then used to analyze the volume of the meshed object and to subtract common geometry from multiple scans. Figure 4 illustrates the software flow for this research.
2.4 Experimental procedure to verify accuracy of CloudCompare
In accordance to learning objective 2, a testing procedure was determined independently to identify the accuracy of CloudCompare. The procedure utilized references blocks to help model the experimental design process (Fig. 3). Two different block sizes acted as a surrogate model for the meniscus and tibia: a large block (tibia) and a small block (meniscus). To represent the tibia and meniscus together, the small block was placed on top of the large block. The blocks were used prior to bovine meniscus testing since they provided a more reliable real-life measurement for volume. There is no defined way to measure the volume of a meniscus without induced error. With the reference blocks, the real-life dimensions were simply measured via calipers (±0.001 in) and a volume calculation was done by finding Width (W) x Height (H) x Depth (D). For each volume found within CloudCompare, it was compared to the real-life volume using a percent error calculation.
For the purpose of verifying the software, two block types were assessed: (1) Blocks without defects to represent a pre-worn meniscus model, and (2) Blocks with defects to represent a post-worn meniscus model. The first block types were analyzed prior to the second type for this verification procedure. This aspect of the test was designed to ensure that CloudCompare was able to accurately find the volume of an object that lacks any minor flaws. This needed to be confirmed before the defect block model was tested in order to confidently say CloudCompare was suitable for the research needs.
2.4.1 Volumes of surrogate block model without defects
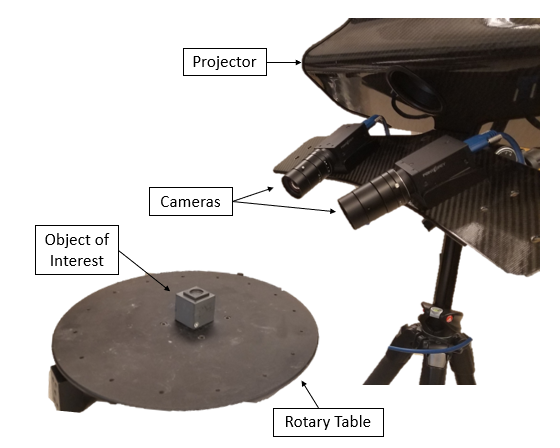
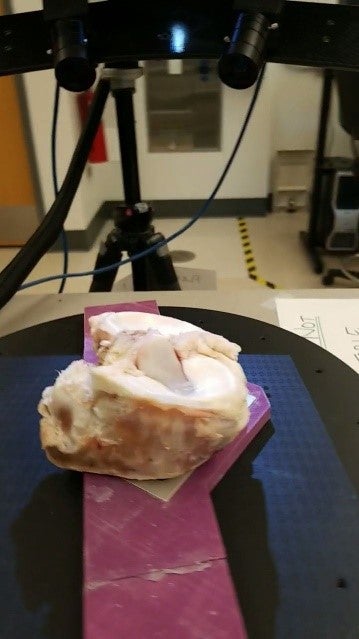
To begin testing, reference blocks were positioned on the 3D optical scanner rotary table (Fig. 5). The blocks were placed approximately centered to two high resolution cameras and a projector. Once the blocks were in the correct position, FlexScan 3D was used to run the scanning setup including the projector, cameras, and rotary table. The projector emitted a series of black and white vertical lines over the object of interest. FlexScan 3D was set to run the projector’s exposure time at 66.67 ms in order to maintain a balanced contrast between black and white light. This contrast allowed for the high-resolution cameras to scan and detect surface changes of the object of interest. While the projector shown the contrast lines on the blocks, the high-resolution cameras would take images of the blocks while the rotary table rotated in a clockwise direction. For this verification test, a total of 8 scans were taken of each block type, large block only and large plus small blocks. One scan was taken every time the rotary table moved 45 degrees. This resulted in a full 360-degree view of the blocks. This scanning process was done for both the large block and the large block with the small block on top.
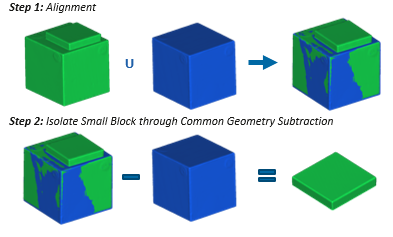
As outlined in figure 4, the scans were then aligned, combined, processed, and finalized in FlexScan 3D. Meshlab was used to remove any duplicate mesh faces, vertices, and points. The cleaned meshed images were imported into CloudCompare for common geometry subtraction and volume analysis. Figure 6 depicts an overview of how geometry was subtracted in CloudCompare to relate the surrogate block model to the meniscus model depicted in figure 3. As shown in figure 6, the green block represents the tibia plus meniscus, the blue is the tibia only, and the small green block represents the isolated meniscus after common geometry subtraction is applied. The volume for each block component was measured within CloudCompare to gain an understanding of error and discrepancies associated between real-life volume and the modeled volume. The entire process of scanning to CloudCompare analysis was done three times using the non-defect blocks.
2.4.2 Volumes of surrogate block model with defects
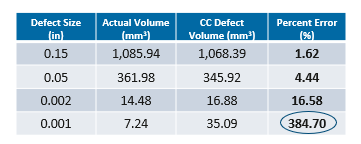
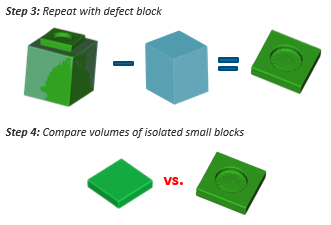
The procedure outline in section 2.4.1 was repeat for a set of defect blocks. To mimic wear within the meniscus, four small blocks were machined at different wear depths within the Boise State University machine shop. Wear depths of 0.15”, 0.05”, 0.002”, and 0.001” were chosen to provide a range of known defects (Fig. 8a). These defect blocks were tested in order to quantify how small of a defect depth the scanner and accompanying software could detect. The process shown in figure 6 was utilized in CloudCompare with the addition of a third and fourth step (Fig. 7). These additional testing steps took into consideration the possible wear depths a meniscus may possess. Since a worn meniscal defect will result in a variation of size and depth, it was pertinent to investigate how accurate the testing methodology was on defect size.
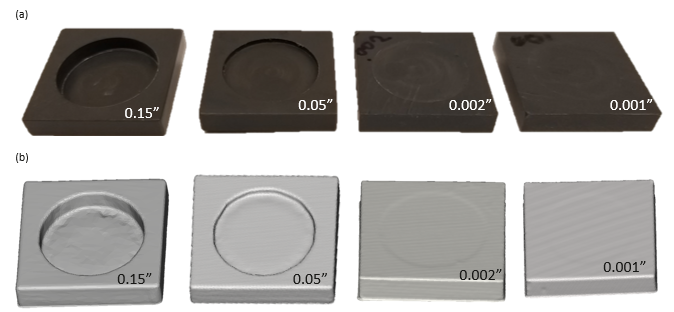
In addition, the block defect testing allowed for the validation of the experimental design model (Fig. 3) to address volumetric losses pre- and post- wear. Figure 8 shows (a) the defect blocks and (b) the accompanying CloudCompare models for each defect depth: 0.15”, 0.05”, 0.002”, and 0.001”.
2.5 Bovine meniscus volumetric analysis
2.5.1 Tibia plus menisci scanning
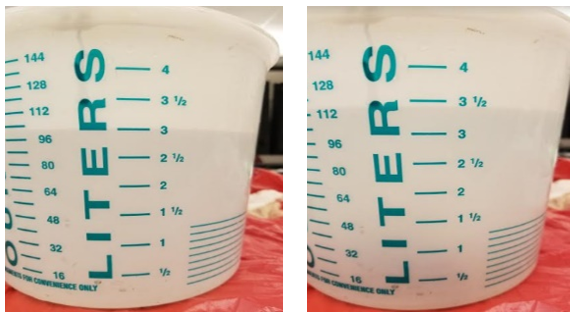
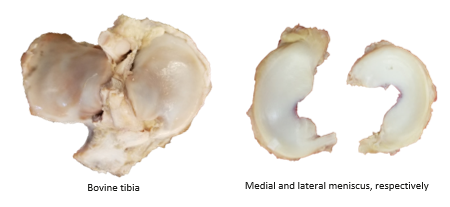
To further progress the project objective, bovine meniscus was analyzed using the methodology developed for this research internship. Prior to scanning, excess soft tissue surrounding the meniscus on the tibia was removed via surgical tools. The removal of the soft tissue done to allow for a closer approximation of menisci plus tibia volume. Once the unnecessary tissue was removed, the entire tibia and both menisci volumes were calculated together using a water displacement method. A laboratory bucket was filled with approximately 3L of water. The tibia and menisci were placed in the water and the amount of displacement change was recorded to be the real-life volume of the tibia plus menisci (Fig. 9). It should be noted that this method of measuring volume induced additional error into the experiment via the uncertainty associated with the bucket’s precision. Once the volume of the tibia plus menisci was recorded, the scanning methodology outlined in figure 4 was used.
The bovine tibia and menisci were positioned flat on the scanning rotary table. Eighteen consecutive scans were taken in this position resulting in a scan taken for every 20-degree rotation of the table. Scans were taken in complete darkness to ensure microscale details of the menisci were capture by the cameras. Once the first eighteen scans had processed, the meniscus was angled in two different positions to obtain another eighteen scans from each different prospective. A total of 54 scans were aligned and processed for the tibia plus menisci.
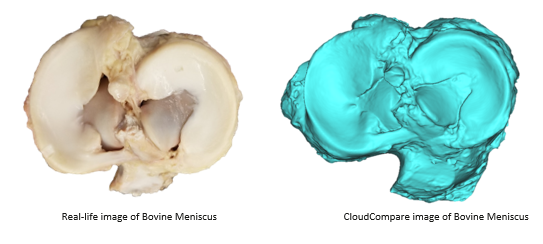
This scanning process took approximately 45 ± 5 minutes to complete. The scans were imported to CloudCompare and a model was created using the software. The real-life image of the tibia plus menisci and the generated model are shown in figure 11.
2.5.2 Tibia scanning
After the tibia and menisci were scanned together, the menisci were dissected from the tibia (Fig. 12). This was done by using a surgical scalpel to cut along the outside perimeter of the meniscus between the meniscal tissue and the tibia bone.
Caution was taken to make sure only the menisci were removed rather than removing additional soft tissue along with the menisci. This was done to ensure the tibia only scans remained consistent with the scans already processed of the tibia plus menisci. Once again, the water displacement technique was utilized to measure the volumes of the tibia only and each meniscus, lateral and medial. The tibia was scanned using the same process as that of the tibia plus menisci scans. The tibia processed scan was used to generate a tibia model within CloudCompare. As per the experimental design (Fig. 4), CloudCompare was used to subtract the common geometry between the tibia plus menisci mesh and the tibia only mesh. Volumes for the lateral and medial menisci were then calculated in CloudCompare.
3. Results
3.1 Volumetric non-defect block error
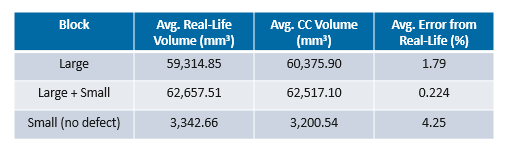
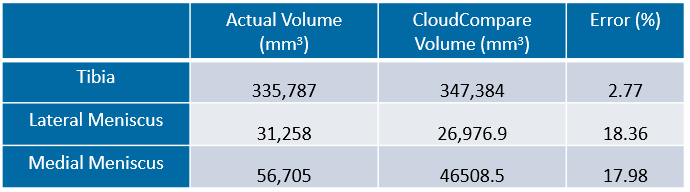
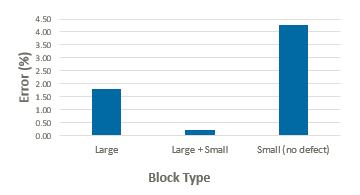
The percentage error between real-life volume measurements and CloudCompare volume analyzes were calculated as a basis for software accuracy. The average error found from initial testing of all non-defect blocks shows percentage errors of less than 5% for each block type (Fig. 12). The small block, representing the meniscus, shows the greatest error of 4.25% when compared to that of the real-volume small block volume. A table of listed volumes for the non-defect block error is shown within the accompanying appendix (Table 1).
3.2 Volumetric defect block error
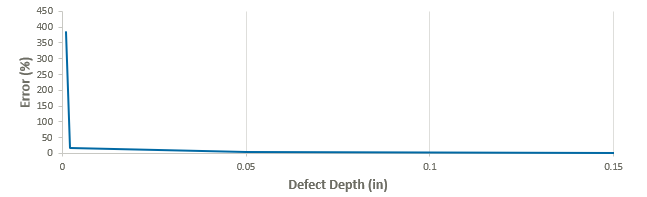
As shown in figure 13, the error for the defect blocks increased as the depth of the defect decreased. The error for the smallest defect depth size of 0.001” was found to be the highest error at 384.7% while the other three defect depths remained under 20% error. It should be noted that the error for the shallowest block is not pictured within figure 13, rather a callout for the data point is listed as (0.001, 384.7) since this point is off the chart.
3.3 Meniscus volumetric error
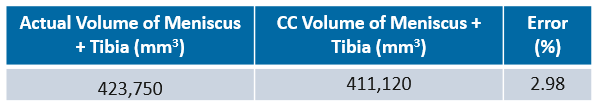
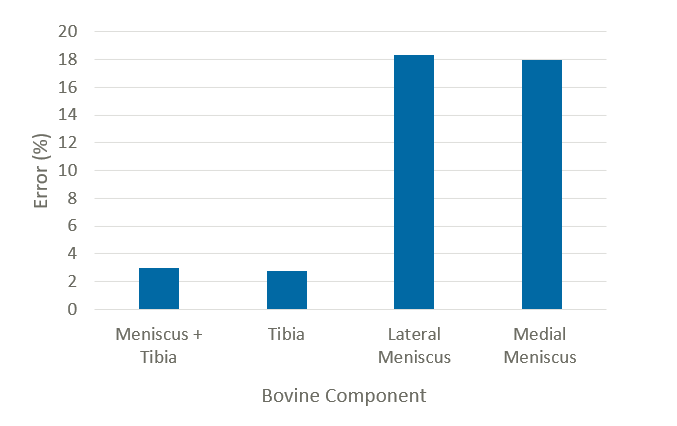
The volume error between the real-life tibia plus menisci in comparison to CloudCompare was approximately 2.98%. The error in the tibia only was 2.77% after the removal of both medial and lateral menisci. The error found within the volumetric analysis of the menisci was larger than that of the tibia plus menisci and tibia only. The medial meniscus volume error was found to be 17.98% while the lateral meniscus volume error was 18.36%. Figure 15 summarizes the volumetric errors of the meniscus components.
4. Discussion
4.1 Research
The timeline for the internship allowed for the main object of the project to be met. From the experiments conducted and the results obtained, it can be shown that the developed methodology utilizing CloudCompare is suitable for analysis. CloudCompare showed minimal discrepancies between real-life volume and calculated volume. The surrogate block model proved that the methodology could be used successfully to scan objects, create meshed images of the object, and evaluate the volume of the object. By utilizing the block model, the meniscus volume could be computed through the use of common geometry subtraction between the tibia plus menisci and tibia only. When percentage errors were calculated, an error of 5% or less was desired to consider the process accurate. As shown in the results, the percentage errors remained under 5% except for the defect blocks with depths 0.002” and 0.001” in addition to the medial and lateral meniscus errors. The shallowest defect block produced the most undesirable error for this research of 384.7%.
From figure 8 of the defect blocks, it can be seen that the modeled blocks in CloudCompare do not show heightened detail for the 0.001” defect. It appears that the model image did not retain enough detail throughout the process of scanning, cleaning the mesh, and common geometry subtraction. For this reason, it is assumed that the limitations of the methodology revolve around microscale defects. From this research, the methodology can be deemed reasonable up to a 0.002” defect. Defects smaller than this depth may not be registered by the scanner nor may not be processed by the accompanying software. To potentially improve upon the defect errors presented within this research and to gain a stronger sense of the defect resolution of the methodology, multiple trial test with different varying defect depths should be conducted. The resolution of the current methodology proves to have limitations when measuring microscale defects. In terms of analyzing wear within a meniscus model, these defect results should be taken into consideration. If degenerative wear of the menisci is on the microscale of 0.001” or less, possible error within the volumetric analyze may be prevalent leading to inaccurate mechanical wear behavior data. With the developed methodology, it can be said that the scanning and volume analysis technique is suitable for analyzing meniscal wear to a certain extent above the 0.001” resolution depth.
The volume errors of the medial and lateral menisci were large in comparison to the desired percentage error of 5%. This could be due to software error during soft tissue recognition. As mentioned in section 2.5.2, both the medial and lateral menisci were removed from the tibia with an attempt at preserving the soft tissue attached to the tibia. During this process, some of the soft tissue that was attached to the tibia during the initial scan of the tibia plus menisci may have been removed. When only the tibia was scanned, the geometry may not have been completely the same as that of the initial scan due to the removal of the soft tissue. As a result, when common geometry of the tibia mesh was subtracted from the tibia plus menisci mesh, the tibia components of each scan may not have aligned properly since some soft tissue from the tibia only mesh was not present. Without this proper alignment, as illustrated by the surrogate blocks (Fig. 6), the common geometry subtraction may have removed parts of the menisci that were not intended to be removed. This removal ultimately caused holes within the mesh in CloudCompare. The holes resulted in menisci meshes that were not water tight. Therefore, the calculated volumes were less than that of the real-life measured meniscus volumes. For this reason, it can be speculated that the increased volumetric percent error between real-life and scanned menisci was a result of improper soft tissue recognition and subtraction. Further testing and a more defined dissection procedure would need to be created in order to solve the error presented within this current research.
As briefly mentioned in the methods overview, volumetric wear is currently measured through a gravimetric analysis or through magnetic resonance imaging (MRI) technologies. Gravimetric analysis uses a microbalance to detect the loss in mass an object [7]. While this technique is considered a standard for measuring wear, it is not applicable to meniscus degeneration research. This is due to the material composition of the menisci. The gravimetric methods are not feasible for measuring the wear of hydrated soft tissue such as the meniscus [8]. MRI imaging technology is more viable to meniscus wear testing since it can image soft tissues; however, methods involving MRI imaging have poor sensitivity to detect small scale changes tissues and require long scanning times [1,8]. While there were errors within the research that were greater than the desired percentage error of 5%, it can still be said that the developed methodology is accurate for analyzing volumetric wear and therefore more practical for measuring wear than other methods. This is due to the volumetric data from the surrogate block model. The model showed that the scanning process and analysis in CloudCompare leads to minimal discrepancies between real-life and scanned data. The developed methodology can be deemed suitable to measure volumetric losses due to wear over other techniques used to measure meniscus wear.
4.2 Internship
4.2.1 Learning Objectives
Throughout the internship, the learning objectives specified prior to research were achieved. The learning objectives are as follows: (1) Gain a strong understanding of 3D optical scanning and accompanying software, (2) Learn how to design and conduct experiments independently to verify procedures, (3) Gain experience in technical communication and documentation. These objectives were unchanged during the course of the work assigned.
The first learning objective was completed within the first three weeks of the internship. A complete understanding of the 3D optical scanner allowed for the continuation of an experimental design procedure to be created. If this objective was not met, then the overall objective of this internship project could not have been accomplished. Section 2.2 of the methods outlines how this learning objective was fulfilled.
The second learning objective was achieved through mentorship. An initial concept for the project was developed before the internship begin. A potential graduate research plan that involved concepts related to this project. The internship focused on aspects of this proposed plan. Certain experiments had to be developed and carried out to test the validity of the methodology used to define volumetric meniscus wear. Experiments were designed independently as an intern using techniques acquired from current literature and knowledge of experimental design gained from the mechanical engineering course Experimental Methods. The above methods sections detail the methodology developed for the purpose of analyzing volumetric wear in bovine meniscus.
The third learning objective was achieved through the documentation process of the internship. A laboratory journal was kept depicting experimental ideas, preliminary data, sketches, and pertinent information related to the internship project. The notes taken in the journal were compiled into weekly reports. These reports were presented at one-on-one meetings with advisor. Meetings were held every Monday and were used to express progress and deliverables pertaining to the project. During these meetings, technical communication skills were utilized to portray data and to discuss challenges and next steps of research. In addition, learning objective three was further fulfilled through the research presentation given to other interns and mentors during the first week of December. This presentation illustrated the outcomes of the internship and allowed for technical communication to be improved through presentation. After the presentation, the intern received feedback from the internship mentors on the quality of the presentation. It was learned from the feedback that the presenter needs to use the allotted presentation time to the best of their abilities. The time of the given presentation was longer than that of the time required. It was mentioned in the feedback that certain aspects of research do not need to necessarily be included within a talk. In addition, feedback was given on how to properly answer questions after a presentation and how to address comments and concerns related to the research. The feedback given allowed for the intern to improve upon technical communication and the presentation of research. This report serves to also accomplish learning objective three by generating an original technical document depicting the overall internship research.
4.2.2 Technical level
This internship allowed for a multitude of new skills to be learned and utilized throughout the course of the semester. The following list depicts the new skills that were acquired as a result of this internship:
- Learning multiple software platforms
- Troubleshooting computer and software issues
- Literature review techniques and storyboarding
- Bovine meniscus dissections
- Working independently and communicating progress
As specified by the first learning objective, 3D optical scanning needed to be understood. The software program FlexScan 3D needed to be learned in order to operate the scanner. In addition, the programs Meshlab and CloudCompare had to be learned to further analyze processed scan images. Each program had a different computer interface and different cursor navigations. A challenge to learning each type of software was keeping track of which software required what keyboard and cursor commands. Since there was limited training for these programs, online technical documents, forums, and videos were used as reference sources to learn the software.
While learning these new programs, issues with certain program features would occur. A new skill of complex troubleshooting was acquired throughout the process of learning the software. For example, the software CloudCompare was having trouble aligning meshes together for common geometry subtraction due to improper scaling. Since the software is open sourced, there are minimal user guides pertaining to the functions and features of the program. In order to troubleshoot issues, online forums were utilized as a reference to resolve problems associated with using CloudCompare. The creator of CloudCompare, Daniel Girardeau-Montaut, was even contacted as an additional reference to help navigate the program. In this regard, the skill of working closely with outside representatives to achieve desired results was also accomplished.
A literature review was conducted for this internship. To keep track of articles read and the information within them, an excel spreadsheet was generated to easily reference pertinent data found. This spreadsheet technique was adopted from advisor and used throughout the review of literature. In addition, a skill of storyboarding was learned. A storyboard consisted of a PowerPoint slide deck that visually represented observations and data to help convey concepts found from literature and experimentation.
In order to work with the bovine meniscus, handling techniques and proper dissection methods needed to be learned. Prior to this project, the intern had limited experience with animal dissections and the use of surgical tools. The skills acquired from working with the bovine meniscus therefore included: learning how to hold a scalpel and cut soft tissue, how to identify unnecessary soft tissue to be removed, and how to properly handle and store specimens.
The most important skill learned from this project was how to work independently and how to solve problems associated with the research. While a fair majority of engineering courses involve independent assignments and projects, this internship allowed for the complete application of self-taught principles and experimental design.
4.2.3 Research impact
The overall impact of this work will help to advance the study of bovine meniscus wear. The addition of the CloudCompare software will allow further volumetric meniscal wear data to be obtained. It should be noted that when Hollar originally proposed this project prior to the internship, the methodology suggested to analyze volume included a greater number of software steps. It was proposed that an image would be scanned through FlexScan3D, then imported to Meshlab to be converted to a mesh, then the mesh was to be imported into a different software to be converted into a solid part. The solid part would be analyzed in SolidWorks to display the volume. This proposed process included four different software programs and was incapable of subtracting common geometry. Therefore, the current methodology (Fig. 4) optimizes the procedure for finding volume while providing a means for subtracting complex meshes from each other to achieve the experimental design concept (Fig. 3).
As described in the methods section, the processing speed of the computer was increased. This allowed for the scanning and processing of scans to commence in a timely manner. This optimization of the scanning process will allow for a greater number of images to be scanned and analyzed without excess wait times. Decreasing the time it takes to scan and process images allows for more time to be spent on different aspects of the experimental design.
Prior to this research, the current methods of measuring wear were limited to gravimetric analysis and MRI imaging. As previously stated, these current methods are not completely feasible for measuring meniscus wear due to limitations within the methods. The methodology devolved for this internship can overcome the limitations of current measuring techniques and provide for an accurate means of quantifying volume loss. Therefore, this research will prove to have a long-term impact on the College of Engineering, in particular, the Northwest Tissue Mechanics laboratory. The developed methodology can be used to further investigate and to understand the wear mechanisms of menisci as a result of degenerative damage.
5. Conclusion
In conclusion, the specified learning objectives were met for this internship and the project objective was accomplished. New skills were acquired to assist with experimentation and research tasks. The work done to develop a methodology for analyzing bovine meniscus wear will prove to have long term beneficial effects for the overall research of meniscus wear. Future work pertaining to this study could focus on inducing wear within multiple bovine menisci via a knee simulator. Volumetric wear of the menisci could then be assessed utilizing the methodology developed during this internship.
Acknowledgments
This material is based upon work conducted for the Northwest Tissue Mechanics laboratory at Boise State University. Special thanks to my mentor within the research lab for the duration of the internship. In addition, a special thanks is granted to my faculty supervisor for serving as a research advisor.
References
[1] Fischenich, Kristine M. et. al. Effects of degeneration on the compressive and tensile properties of human meniscus, Journal of Biomechanics. 48 (2015) 1407-1411.
[2] Howell R, Kumar NS, Patel N, Tom J. Degenerative meniscus: Pathogenesis, diagnosis, and treatment options. World J Orthop. 5 (2015) 597-602.
[3] Englund, M. et. al. Incidental Meniscal Findings on Knee MRI in Middle-Aged and Elderly Persons, N Engl J Med. 359 (2008) 1108-1115.
[4] Hollar, Katherine A. et. al. Quantifying wear depths in hip prostheses using a 3D optical scanner, Wear. 394 (2018) 195-202. [5] Normal anatomy of the knee. (2014). Image. Available at: https://orthoinfo.aaos.org/en/diseases–conditions/meniscus-tears
[6] Degenerative tear (2014). Image. Available at: https://orthoinfo.aaos.org/en/diseases–conditions/meniscus-tears
[7] Saikko, Vesa et. al. Wear simulation of total hip prostheses with polyethylene against CoCr, alumina and diamond-like carbon, Biomaterials. 20 (2001) 1507-1514.
[8] Hollar, Katherine A. Graduate research plan, 2018.
Appendix
The following appendix contains raw data and information pertinent for the internship and research report.