Commute Mode Shift In Boise
Report Authors
- Matthew May, PhD, Senior Research Associate
- Gabe Osterhout, Research Associate
- Emily Pape, Research Assistant
This report was prepared by Idaho Policy Institute at Boise State University and commissioned by City of Boise.
Recommended citation: May, M., Osterhout, G., Pape, E. (2020). Commute mode shift in Boise 2020. Idaho Policy Institute. Boise, ID: Boise State University.
Download a printable pdf of this report
Executive Summary
As high single-occupant vehicle (SOV) usage is typically accompanied by increased congestion and more pollution, many cities have begun to pursue policy agendas aimed at reducing the amount of SOVs on the road. This is often paired with increasing the use of alternative transportation methods such as carpooling, bicycling, or public transit options like buses. Towards that end, the City of Boise has stated its commitment to educating and encouraging its residents to use alternative modes of transportation—or, rather, shift their mode of transportation.1
In order to better understand common barriers to mode shift and best practices to encourage wider adoption among the population, the city partnered with the Idaho Policy Institute (IPI) to conduct a third-party analysis of transportation mode shift. In addition, this study seeks to identify what characteristics are shared by likely mode shifters in order to better inform policy decisions going forward.
The study’s major findings include:
• Encouragement from policy makers is a vital component of success in breaking existing transportation habits.
• Boise has a high incidence of SOV usage (over 80% of commuters). While SOV usage remains high in the downtown area, it also has more diverse mode use patterns, with greater bicycle and bus usage than the rest of the city. The relative success of the downtown area in diversifying mode choice can help identify and inform successful policy approaches citywide.
• While many barriers to mode shift exist, it is important to understand individuals are affected by specific barriers in different ways. While some barriers are real and require physical solutions (such as additional infrastructure), others are only perceived barriers and can be addressed through targeted awareness campaigns.
• Best practices for encouraging mode shift include a structured, data-driven approach and the employment of push and pull measures, such as parking management policies that push commuters away from SOV usage or financial subsidies that pull commuters toward mode shift alternatives. These policies can take the form of free bus passes, new infrastructure, or employer benefits.
• Having transportation policy goals in mind when making decisions in non-transportation areas creates a better environment for success.
Return to the beginning of the report
This report begins by looking at commuting habits in Boise at-large and its downtown area specifically. It then examines common barriers to transportation mode shift, followed by a summary of best practices for encouraging mode shift within the population. The report concludes with a look at the characteristics of a typical mode shifter and summarizes alternatives that the city might consider in order to achieve its goal of encouraging mode shift behavior among its residents.
Return to the beginning of the report
The City of Boise has a high incidence of SOV usage. According to the U.S. Census’ American Community Survey (ACS), 88% of daily commutes are made via car—including both SOV and carpool options. A 2019 Idaho Policy Institute (IPI) survey of downtown Boise commuters2 shows an even greater percentage of car usage, with 95% indicating that a car is typically part of their daily commute.
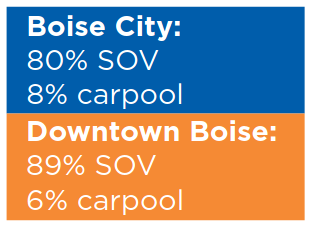
Downtown Boise differs from other Boise neighborhoods in terms of alternative modes of transportation, such as riding bicycles, walking, or taking public transportation. Bicycle usage sees the greatest difference, with 3% of commuters city-wide reporting cycling to work compared to 18% of downtown workers. Similar differences are found among commuters who walk or use public transportation options like buses; the percentage is higher for downtown workers. While car usage remains high throughout Boise, transportation mode choice is much more diversified in the downtown area. These commuting habits are summarized in Table 1.
According to the ACS, over half of Boise City residents who commute (60%) reported a travel time of 20 minutes or less, while the longest commute was over an hour.
Table 1: Overview of Commute Mode Choice in Boise
| Boise City U.S. Census ACS (2018 5-year estimates) |
Downtown Boise Area Idaho Policy Institute DMC Survey (2019)* |
|
|---|---|---|
| Drive Alone | 80% | 89% |
| Carpool | 8% | 6% |
| Bicycle | 3% | 18% |
| Walk | 2% | 9% |
| Public Transportation | <1% | 8% |
| Other | 7% | 5% |
* Downtown Mobility Collaborative survey respondents were asked which transportation modes they typically used in their commute and could indicate more than one option; as such, percentages do not add to 100.
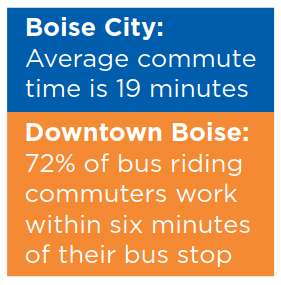
While total travel times are not available for all downtown Boise commuters, 72% of those who walked or biked to the bus stop reported that their journey took six minutes or less. Respondents 45 years old and younger were more likely to walk or ride to their bus stop, although responses exceeded 50% for all age groups.3
Knowing the existing transportation habits of commuters is critical in order to identify both areas of improvement and successful strategies for encouraging mode shift. Next, this report reviews some of the common barriers to mode shift and how they can be overcome.
Return to the beginning of the report
In a general sense, barriers determine whether individuals are willing and able to change their behavior. According to the Toronto Cycling Think & Do Tank, individuals and communities experience different combinations of barriers. “Once barriers are identified a more targeted and context-specific approach to promote the desired behavior change can be implemented, ensuring best results.”4 To reduce or eliminate barriers to behavior change, barriers must first be identified and understood in context.
This section considers the following barriers to shifting individuals’ transportation modes and their applicability to Boise’s context: (1) habit, (2) time and distance, (3) reliability and frequency, (4) safety, (5) convenience and comfort, and (6) weather.
Habit
One of the primary barriers to mode shift is the individual tendency to rely on existing habits. When choosing a mode of transportation, a person’s past behavior is strongly correlated with their future behavior.5 In many parts of the United States, including Boise, this translates to an overreliance on SOVs. Car dependency is appealing because it is perceived as “more comfortable, flexible, and faster for supporting busy lifestyles” than other transport alternatives.6 As a result, having access to a car often prevents individuals from choosing another mode of transportation.
According to ACS figures, 99% of Boise workers have access to at least one vehicle and nearly 9 of 10 workers commute by driving a car, truck, or van.7 Even in downtown Boise, where there are fewer physical and socioeconomic barriers to shifting modes, IPI’s recent survey found that 76% of workers have not switched from driving alone to another form of transportation, suggesting that existing habits are particularly strong.8 To reduce the habitual barrier, Boise residents could be encouraged to sample alternative modes of transportation, possibly leading some to reconsider their dependency on SOVs.
Time and Distance
Farther distances and longer trip times often encourage people to choose personal vehicles over walking, bicycling, and public transportation. A market research study of people who use transit infrequently suggests the two main barriers to public transportation are lack of access and that it is time consuming or slow. An overwhelming majority of respondents said they were “definitely or probably willing to try transit if [their] primary barrier was removed.”9 Longer travel times and more effort also lead to less desire for people to travel by bicycle.10
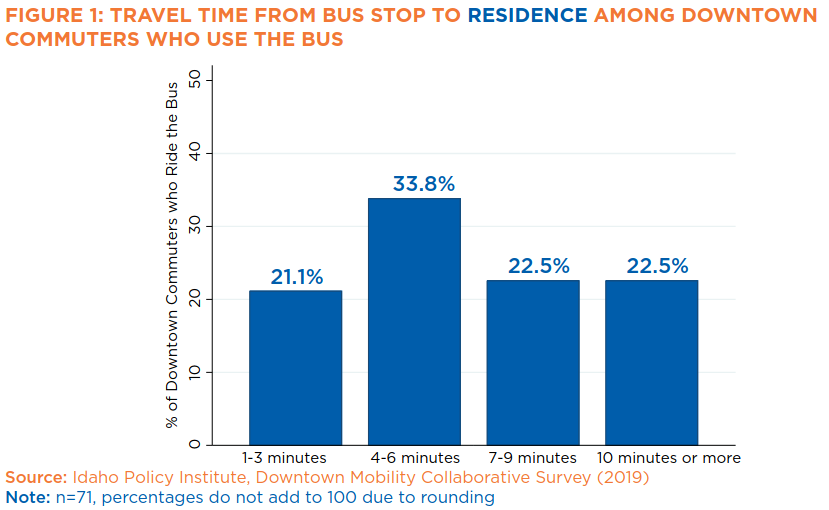
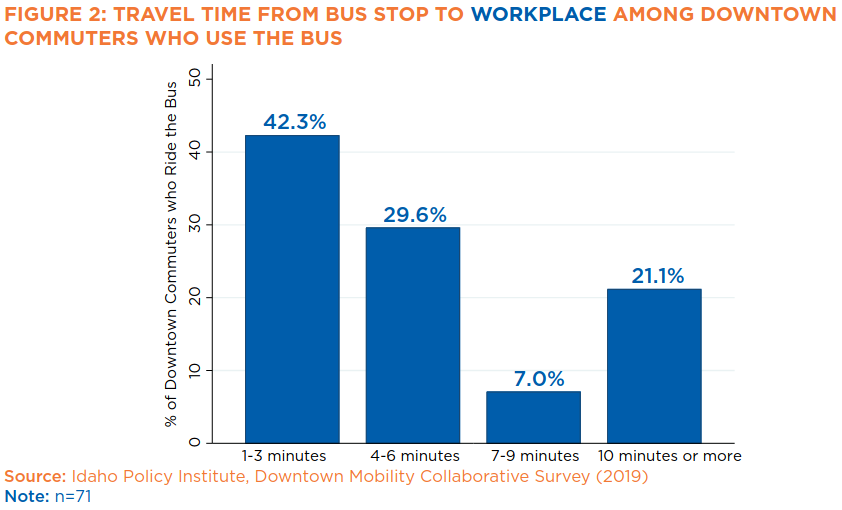
As shown in Figures 1 and 2, among workers in downtown Boise who commute by bus, over 20% report traveling 10 or more minutes to the bus stop from their residence or place of work.11 However, this figure does not capture the number of workers who avoid taking the bus altogether due to much longer travel times. Time and distance may act as barriers to some Boise residents’ willingness to change modes. As a result, these barriers could be reduced by providing more access, such as shortening the distance to bus stops and faster travel times.
Reliability and Frequency
Another barrier to mode shift exists if public transit is, or is perceived as, unreliable, especially since car travel is often seen as a reliable and predictable mode of transportation. Similarly, lower frequencies make public transportation more inconvenient, given the associated waiting times and planning ahead required to reach a destination on time.12 In parts of Boise, these can act as barriers since the regional transit system has limited frequencies on some of its bus lines, and the system’s limited hours of service cannot compete with the reliability and flexibility of a personal vehicle. More frequent service and better hours on bus lines could reduce these barriers for Boise residents.
Safety
Bicycling is often perceived as less safe than driving a car or other transportation alternatives, including walking and taking public transit. People are less likely to bike if they believe there is a higher risk of having a collision.13 Adding to this fear is evidence suggesting that people remember dangerous routes better than normal routes.14 Whether cycling is objectively safe or unsafe may be context-specific, but subjective fears can serve as a perceptual barrier to mode shift. Interestingly, a study in California found that cities with higher bicycling rates have a lower risk of fatalities among all road users (vehicle occupants, pedestrians, and bicyclists) since bike-friendly cities tend to have safer street networks.15 The concerns of safety-minded Boise residents could be alleviated with improved and more connected bicycle routes, while awareness campaigns could dispel some of the myths surrounding bicycle safety.
Convenience and Comfort
While bicyclists’ perceived level of comfort is also largely subjective, it too is a common barrier. For instance, a survey of bicyclists found that those “who bicycled for commuting purposes, who made shorter trips, who bicycled more frequently, and who had more exposure to downtown bicycling reported higher levels of [perceived comfort].”16 Otherwise, people with less biking experience may expect a bike ride to be less comfortable and enjoyable, and as a result opt to drive to their destination instead. Similarly, several studies have shown the “convenience and flexibility of the car as a significant barrier to mode shift” compared to the inconvenient nature of public transit.16 To clear up misperceptions regarding these barriers, Boise residents could be encouraged to try alternative modes of transportation before making assumptions about their levels of convenience and comfort.
Weather
Unpleasant weather serves as a barrier to all types of mode shift. While public transit vehicles, such as buses, may offer protection against the elements, people are exposed to the weather while getting to and waiting at transit stops. Days with bad weather “may form a barrier…and also reinforce other barriers by making station access and the waiting experience more unpleasant than would otherwise be the case, particularly if access is by bike or on foot or if no sheltered waiting areas are available.”18 Such conditions are even more prohibitive to walking and biking.
Boise’s seasonal extremes add to the barriers of choosing alternative modes of transportation. Hazardous air quality and hot temperatures in the summer and freezing temperatures in the winter can make biking to work or waiting at the bus stop an unpleasant experience, reinforcing residents’ reliance on personal vehicles. However, high bicycle commuting rates among midwestern cities with severe winter conditions suggests this is more of a perceptual barrier. Research also shows that the weather is less of a barrier in cities that have safe infrastructure and winter maintenance for bike lanes.19 As a result, more durable biking infrastructure and maintenance, in addition to education efforts, could lead more Boise residents to choose to commute by alternative modes regardless of the time of year.
Policy Strategies
To reduce or eliminate barriers to behavior change, barriers must first be identified and understood in context. This section identifies several barriers to transportation mode shift among Boise residents, including habit, time and distance, reliability and frequency, safety, convenience and comfort, and weather. Although this examination was bounded by barriers applicable to Boise’s context, individuals may be more or less affected by different combinations of barriers depending on their circumstances.
It is important to note the difference between real and perceived barriers. For instance, one may assume that commuting by bicycle is less safe or more uncomfortable than driving a car, but the actual disadvantages of shifting modes may be less of an issue in reality. This suggests that perceptual barriers could be reduced by awareness campaigns.
Other barriers could be mediated by encouraging mode shift sampling, increasing access to and frequency of public transportation, and improving walking and bicycling infrastructure. By reducing these barriers, residents may be more willing to commute by alternative modes of transportation.
In the next section, this report outlines and examines best practices for encouraging mode shift among residents.
Return to the beginning of the report
Mode shift can be encouraged through a variety of best practices. These include (1) a general step-by-step process, (2) targeting push and pull measures, (3) employing behavioral policy techniques, (4) implementation of technology, and (5) creating a broad policy landscape conducive to alternative transportation.
Step-By-Step Process
Throughout best practices, a specific step-by-step process has been effective in driving mode shift. The first step involves measuring existing mode shares, followed by conducting an analysis of mode share potential. On the basis of these data, the next step is to establish mode share targets and begin developing policies to meet those targets. Following the funding of those policies, the final step is implementing them.20
For instance, if on the basis of their mode share analysis a city were to establish a target of reducing private car use to a desired level, potential policy options would include road pricing, such as implementing congestion zones, and driving or parking restrictions in high-use areas, such as downtown Boise.21 Research suggests providing alternatives that people find appealing and will actually use is often a successful strategy to encourage mode shift toward other forms of transportation. This is especially true when policies are paired with personal stories and positive marketing efforts.22
As a result, developing policies with this incremental step-by-step process in mind and pairing them with appropriate marketing efforts is one practice that can help lead to successful mode shift.
Push and Pull Measures
To facilitate mode shift, there are both push and pull measures. Where push measures deter people from private car use, pull measures typically attract them to alternatives such as transit. Common push measures include congestion charging and parking regulations. Alternatively, pull measures usually involve developing policies that address several of the barriers identified in the previous section, including cost, safety and security, comfort, frequency, reliability, journey time, and ease of use.23
Urban planning can act as both a push and pull measure. For example, closing street access to cars can push individuals to transportation alternatives with greater access, while the availability of bike racks, end of trip facilities, and other infrastructure can act to pull individuals away from private car use. As such, policies can be developed to target both push and pull factors in mode shift.
A Seattle-area study helps demonstrate how parking management (a push measure) and financial subsidies for alternatives (a pull measure) can incentivize a mode shift.24 Researchers found that higher SOV parking charges, great discounts for HOV parking, and lower onsite ratios for parking space all made commuters more likely to choose alternatives to driving alone.25 Additionally, implementing direct financial subsidies that applied to alternative modes positively impacted commuters to choose transportation options other than driving alone, though it is important for employers to both provide services to help commuters understand the programs offered as well as send supportive signals.26 Ultimately, researchers found that HOV infrastructure and raising awareness contributed to commuters shifting away from driving alone to work.
Behavioral Policy Techniques
There are also several behavioral components to encouraging mode shift. Within behavioral solutions, there are three broad categories: (1) incentivizing commuters to try it again, (2) making it a habit, and (3) using it well.27
In order to encourage commuters to try it again, research suggests that policies should nudge people at opportune moments (such as after moving or starting a new job), reframe and promote opportunities for real time trip tracking, implement “try before you buy” incentives, target messaging at negative perceptions of public transportation, and simplify the payment process.28 Studies observe that “when people face uncertainty and are searching for information, they are more open or susceptible to trying new travel choices,”29 and policies that target such situations, including higher gas prices or a change in housing or employment, will be more effective at creating effective mode shift.
In terms of making it a habit, one effective strategy that has been used is for policies to focus on leveraging defaults, such as requiring opt-outs rather than opt-ins—for example, automatically refilling a transit card each month instead of requiring the user do it manually. Another option is to implement creative incentives to encourage more alternative mode usage.30 Additionally, evoking personal values and identity in messaging, increasing salience of messaging, and helping people commit to a plan has also been found to be effective.31
Finally, when it comes to using it well, policies that help ensure once a habit is established it is continued are often successful. This is typically accomplished by making the transportation alternative an attractive option and can be reinforced by policies that make the ride more social, redistribute demand using gamification, and cause residents to rethink their commute.32
A case study in California helps illustrate the success of a behavioral policy approach. The study, which happened to coincide with increasing gas prices, examined the effect of a free bus pass on commuters’ choice of mode to travel to work.33 For three months drivers were offered a free bus pass in exchange for their parking permits. Once the three months were up, those participating in the study had the choice of getting their parking permit back or buying a 50%-subsidized bus pass. The study used a social marketing approach, where a free sample serves as an incentive, though they note “the sample must be generous.”34 At the conclusion of the study, “of the 381 enrolled in the experiment, 70% continued to use transit (or alternative transportation) after the trial. Only 114 (30%) returned to parking, even as gasoline prices started to moderate.”35
Finally, although it is useful, research has shown that these alone are not sufficient to break deep ingrained habits. Instead, public programs are successful when they are personalized, include active voluntary participation, and flow from the bottom up.36
Technology
Much attention has been given to the role of technology, such as the role of smartphone applications in a mode shift effort. Results are varied across existing research. A study in Switzerland37 found that a smartphone app has the potential to be an ideal tool for a city to deliver messages encouraging a transition away from SOVs. Another study found that streamlining payments for trips that use multiple modes on a single trip (for instance, ride shares and buses) into a unified payment system is another way to effectively encourage mode shift.38
In addition to providing citizens with real-time feedback and motivation, an app also has the ability to collect mobility data that could aid city planning. However, the use of such an app may present challenges in scaling up to the city level, in addition to privacy concerns.
Policy Landscape
From a long-term, developmental perspective, there are several other components of public policy that can supplement mode shift interventions, beyond simply transportation. Success is more likely when a holistic approach is taken, as no policy area exists in a vacuum. As such, the entire policy landscape must be kept in mind, specifically the interrelationship of transportation policy with other policy areas.
In addition to embracing urban planning that emphasizes multimodal transportation (low speed limits, bike lanes, and sidewalks), cities aiming to shift from majority single-occupant vehicle use to a more transit-oriented transportation system often invest in policies that emphasize sidewalks and walkability, transit-oriented development, high density development, and affordable housing.39
Policy Strategies
From broad steps to specific case studies, there are numerous strategies the City of Boise can take to drive mode shift at a local level. These include a step-by-step process to encourage mode shift, which entails setting data driven targets, developing policies to achieve these goals, and positive marketing efforts. Other successful strategies include using a combination of push and pull measures—such as stricter parking regulations, wider access to bike racks, or subsidized bus passes—to encourage greater mode shift.
Behavioral techniques to mode shift are most successful when they allow commuters to try alternatives, make their use a habit, and continue to use them. Successful strategies include nudging individuals at opportune moments—such as during a job or residential move—leveraging opt-outs over opt-ins, and making alternative transportation options more comfortable and attractive than driving alone.
Additionally, investing in technological support, such as a smartphone app, and crafting a broader urban development pattern are both appropriate strategies for mode shift and can work in concert with one another. Ultimately, a combination of these strategies and others can be employed to change the way people commute.
In the next section, this report examines the characteristics that mode shifters have in common in order to facilitate a targeted mode shift policy strategy.
Return to the beginning of the report
As previous sections noted, research shows that commute mode choice is highly habitual behavior.40 Commuters are set in their ways and often perceive that they have arrived at their preferred mode choice because it constitutes the best alternative, especially for the locations of their home and workplace.41 As a result, most mode shift initiatives are designed to break the public’s habit of SOV usage.42 Towards that end, understanding what characteristics may have led to their initial decision is useful.
Using a combination of existing mode shift studies and the 2019 survey of downtown Boise commuters, this section seeks to identify the demographic characteristics of individuals who are more likely to shift modes. Of the 1,220 survey responses collected, 24% (293 responses) indicated that they had switched their mode of transportation away from driving alone—7.4% (90 responses) within the last year and 17% (203 responses) prior to that. This section focuses on these respondents by looking at five characteristics that have been identified in existing mode shift studies: (1) travel time, (2) age, (3) gender, (4) education, and (5) income.
Due to the relatively low sample size on some response categories, survey results of downtown Boise mode shifters cannot be generalized to the larger Boise population. However, these results can provide further insight into which characteristics mode shifters have in common, which in turn can inform public policy decision-making.
Travel Time
Several existing studies have emphasized that travel time from one’s residence to their place of work is one of the most significant factors that can encourage mode shift.43 In a California study, individuals who explored mode shift but ultimately decided against it were motivated by the fact that their travel time would increase substantially over driving alone.44
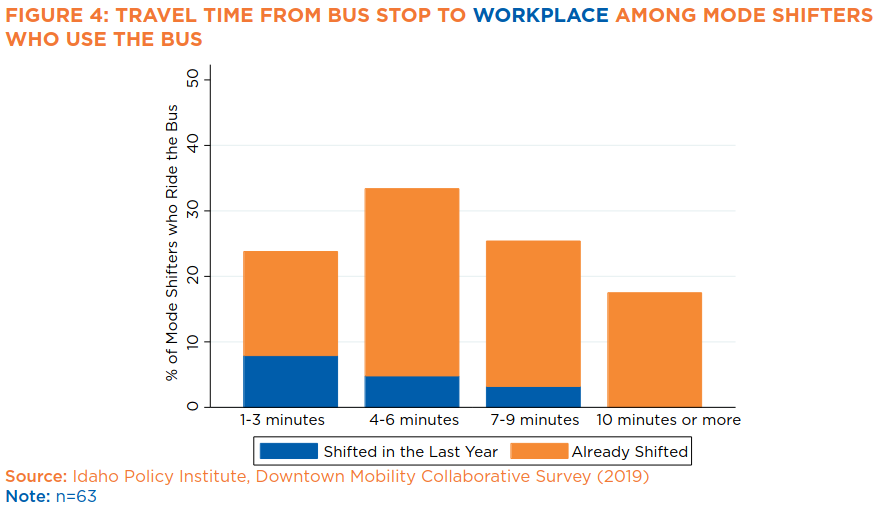
As noted, while the downtown Boise survey did not study total travel time from home to workplace, it did include travel time to and from bus stops (shown in Figures 1 and 2). When these responses are further limited only to those who shifted modes, the results are interesting. Among all mode shifters who use the bus, travel time is fairly distributed across response categories, although a majority (57%) live within six minutes of their bus stop. Figure 3 summarizes their response.
When location is switched to workplace (see Figure 4), the distribution of response differs. Mode shifters as a whole appear to skew towards lower travel times to the office, as 73% work within six minutes of their bus stop and the most common reported travel time was four to six minutes. Among recent mode shifters only, however, a travel time of three minutes or less was the most frequent response. The remaining reported working more than 10 minutes from the stop. This suggests that bus stop proximity to the office affects whether people commute by bus.

Age
Several studies have looked at the impact of age on mode shift, though most find little to no effect.45 While some studies show seniors as more likely to choose to drive alone over walking to a transit option,46 other studies have found that those over 60 years of age are more likely to exhibit random mode use patterns.47 Another study found that age is statistically significant in predicting shifts from using a bicycle, but not when shifting to using a bicycle.48 This is likely due to riders aging to a point where they are no longer physically able to continue using a bicycle on a daily basis.
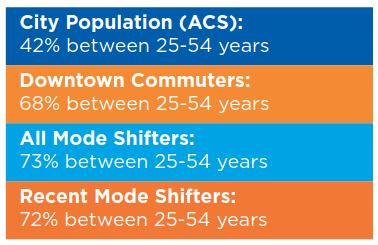
Among downtown Boise commuters, those who had shifted modes in the last year were highly concentrated between 25 and 54 years old.
Gender
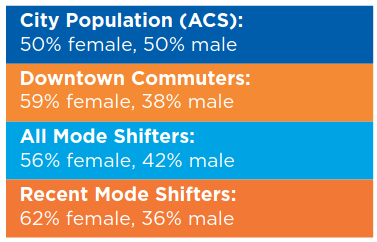
Like age, gender is a characteristic that many mode shift studies have examined. Generally, gender has been found to have no statistically significant effect on the likelihood that an individual will shift their mode of travel.49 There are conflicting findings, however, as one study found that women were more likely to choose a commute option that includes driving (either carpooling or driving to a transit station) than walking to a transit station.50
Among downtown Boise commuters, 62% of those who reported shifting modes in the last year were female, while 36% were male (the remaining respondents declined to specify their gender). While this would seem to support the finding that women are more likely to try alternative commute modes than men, it should be noted that these numbers are similar to the gender distribution of downtown commuters as a whole.
Education
When it comes to assessing the impact that level of education plays on mode choice, there is again no clear pattern on the question of larger mode choice. While some studies show that a university education can decrease the likelihood of an individual shifting to use a bicycle,51 another study found that as an individual’s education level increases, the more likely they were to use a park-and-ride commute option.52 Since these studies looked at two distinct mode choices (bicycles and park-and-ride), they may not actually be in conflict. But they do not indicate a clear trend.
Data from the downtown Boise survey generally supports the park-and-ride study. The majority of respondents who reported switching their commute mode in the last year had a bachelor’s degree or higher. Again, however, this mirrors characteristics of downtown commuters as a whole.
Income
Some mode shift studies suggest that more affluent individuals are more likely to choose carpool mode shift options over walking to public transit.53 Another study suggests that individuals among the highest income levels are less likely to switch to park-and-ride options.54 It may be that greater income gives greater financial ability to explore alternative transportation modes. This is supported by another study which finds that when individuals begin cohabitating with one another, they become less likely to switch away from a mode choice like a bicycle, presumably due to greater financial obligations.55
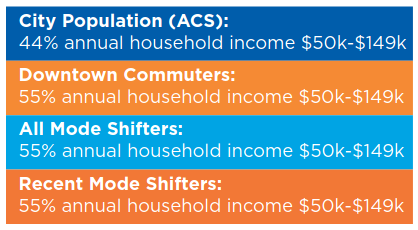
The majority of downtown Boise mode shifters had an annual household income ranging from $50,000 to $149,000. Conversely, very few mode shifters reported an annual income of $24,999 or less. This may suggest that having the financial flexibility to shift modes can have a large impact and those with financial resources in excess of $150,000 are less likely to shift from their preferred mode of transportation. Again, mode shifter income levels mirrored those of downtown commuters as a whole.
Family Size
While not addressed in the downtown Boise survey, there are additional characteristics that have been identified as strong indicators of mode shift. Among these, family size exhibits the most impact. In the California study where commuters surrendered their parking passes in exchange for free bus passes, most of those who stayed with the new mode of transportation had either no children or only one child.56 Those who expressed interest in the study but ultimately chose not to participate had larger families, suggesting that successful mode shift is more difficult for larger households. A separate study found that the birth of a first child had a positive influence on shifting commuters from a bicycle to a car, as safety of the child and transport to daycare options became an overriding concern.57

Policy Strategies
From these characteristics, two strategies for mode shift are evident. The first is best described as a physical solution. Since many Boise mode shifters live less than six minutes from their home bus stop, ease of access is one successful strategy. This would include ensuring transit lines and stops are situated in areas where they are more likely be used, such as in close proximity to heavily populated residential areas.
The second strategy deals more with persuasion and targeting resources appropriately. Most mode shifters live within 10 minutes of their bus stop. Therefore, targeting awareness resources within a 10-minutes radius of transit lines is one way that data can better inform outreach efforts.
Additionally, studies and survey data can be leveraged to achieve short-term gains by targeting mode shift efforts at specific demographic categories that already predominantly mode shift. At the same time, it is also useful in informing a long-term policy strategy for increasing mode shift among demographic categories that data suggests are less likely to.
Return to the beginning of the report
Understanding common barriers to mode shift and the best practices to encourage wider adoption among the population is critical if cities want to reduce the number of cars on the road. A vital component of success and breaking existing transportation habits is encouragement from city leaders and stakeholders. However, additional infrastructure, such as new bus stops or increased alternative transportation options, can also help increase mode shift.
Some of the best practices for encouraging mode shift identified in this report include a step by step process, push and pull measures (such as parking management and financial subsidies for commuters switching away from SOVs), the integration of behavioral policy strategies, technological integration (such as a smartphone app), and embracing urban planning that emphasizes integration of alternative transportation modes.
It is important to keep in mind that individuals are affected by specific barriers—or combinations of barriers—in different ways. In fact, while some barriers may be real, others may only be perceived. While the former may require physical policy solutions, the latter may be targeted by awareness campaigns, which in turn can lead to more commuters willing to try alternative means of transportation.
Finally, actions the city and other stakeholders take to encourage mode shift should be not only data-driven, but also regularly evaluated to ensure resources are targeted toward the most effective and efficient measures.
Return to the beginning of the report
Abadi, M.G., Hurwitz, D.S., & Macuga, K.L. (2019). Towards safer bicyclist responses to the presence of a truck near an urban loading zone: Analysis of bicyclist perceived level of comfort. Journal of Safety Research, 71(2019), 181-190.
Alta Planning and Design, Behavioural Insights Team. (2018). Behavioural Insights to Transportation Demand Management.
Batty, P., Palacin, R. and González-Gil, A. (2015). Challenges and opportunities in developing urban modal shift. Travel Behaviour and Society, 2(2), 109-123.
Blainey, S., Hickford, A., & Preston, J. (2012). Barriers to passenger rail use: A review of the evidence. Transportation Reviews, 32(6), 675-696.
Cao, J., Fan, Y., Guthrie, A., & Zhang, Y. (2015). “Exploring Strategies for Promoting Modal Shifts to Transitways” in Transitway Impacts Research Program. University of Minnesota.
Cellina, F., Castri, R., Simão, J. V., and Granato, P. (2020). Co-creating app-based policy measures for mobility behavior change: A trigger for novel governance practices at the urban level. Sustainable Cities and Society, 53, 101911.
City of Boise. (n.d.). Keep Boise moving. https://www.cityofboise.org/programs/keep-boise-moving/
C40. (2019, March). “How to drive a modal shift from private vehicle use to public transport, walking and cycling.” C40 Knowledge Hub. https://www.c40knowledgehub.org/s/article/How-to-drive-a-modal-shift-from-private-vehicle-use-to-public-transport-walking-and-cycling?language=en_US.
Frei, A. & Gan, H. (2015). “Mode-switching behavior with the provision of real-time multimodal traveler information.” Transportation Research Record, 2496, pp. 20-27.
Geis, I. & Schulz, W.H. (2016). Incentivizing modal change: Exploring the effect of multimodal information and ticketing systems for medium and long distances in Europe. Transportation Research Record, 2565, pp. 1-7.
Gould, J. & Zhou, J. (2010) Social experiment to encourage drive-alone commuters to try transit. Transportation Research Record, 2144, pp. 93-101.
Heinen, E., Harshfield, A., Panter, J., Mackett, R. & Ogilvie, D. (2017). Does exposure to new transport infrastructure result in modal shifts? Patterns of change in commute mode choices in a four-year quasi-experimental study. Journal of Transport & Health, 6, pp. 396-410.
Heinen, E., Van Wee, B., & Maat, K. (2010). Commuting by bicycle: An overview of the literature. Transport Reviews, 30(1), 59-96.
Idaho Policy Institute. (2019). Downtown mobility collaborative survey results.
Jaffe, E. (2016). How to keep cyclists riding even in the frigid snowy winter. CityLab. https://www.citylab.com/transportation/2016/01/winter-bike-riding-seasonal-cycling/426960/
Majeed, S. & Batool, Z. (2016). “Evaluation of factors encourage public transit usage: A case study of Lahore.” Pakistan Journal of Science, 68(2), pp. 184-194.
Marshall, W.E., & Garrick. (2011). Evidence on why bike-friendly cities are safer for all road users. Environmental Practice, 13(1), 16-27.
Oakil, A.T.M., Ettema, D., Arentze, T. & Timmermans, H. (2016). Bicycle commuting in the Netherlands: An analysis of modal shift and its dependence on life cycle and mobility events. International Journal of Sustainable Transportation, 10(4), pp. 376-384.
Redman, L., Friman, M., Garling, T., & Hartig, T. (2013). Quality attributes of public transport that attract car users: A research review. Transport Policy, 25(2013), 119-127.
Su, Q. and Zhou, L. (2012). “Parking management, financial subsidies to alternatives to drive alone and commute mode choices in Seattle.” Regional Science and Urban Economics, 42(1), 88-97.
Thogerson, J. (2006). Understanding repetitive travel mode choices in a stable context: A panel study approach. Transportation Research Part A, 40(2006), 621-638.
Toronto Cycling Think & Do Tank. (n.d.). A toolkit to accelerate the adoption of cycling for transportation: Literature matrix. https://www.torontocycling.org/uploads/1/3/1/3/13138411/literature_matrix_with_cover_page.pdf
U.S. Census Bureau. (2018). American Community Survey 5-year estimates: City of Boise.
Return to the beginning of the report
- City of Boise (n.d.)
- In November 2019, the Idaho Policy Institute in partnership with the Downtown Mobility Collaborative
(DMC) surveyed 1,220 individuals over a one-month period. The survey was distributed by Boise State
University, the City of Boise, the Boise Metro Chamber of Commerce, and St. Luke’s Boise Medical
Center. While results cannot be generalized to the wider population, they are generally consistent
with expectations for Downtown Boise commuters and provide greater insights into how downtown
commuting habits differ from the city at large. - Age groups consisted of 18-24 years old; 25-34 years old; 35-44 years old; 45-54 years old; 55-64 years
old; and 65 years and older. - Toronto Cycling Think & Do Tank.
- Thogerson (2006).
- Redman et al. (2013, p. 119).
- U.S. Census Bureau.
- Idaho Policy Institute (2019).
- Alta Planning & Design (2018, p. 10).
- Heinen, Van Wee & Maat (2010).
- Idaho Policy Institute (2019).
- Blainey et al. (2012, p. 678).
- Heinen, Van Wee & Maat (2010).
- Heinen, Van Wee & Maat (2010).
- Marshall & Garrick (2011).
- Abadi, Hurwitz & Macuga (2019, p. 181).
- Blainey et al. (2012, p. 684).
- Blainey et al. (2012, p. 690).
- Jaffe (2016).
- C40 (2019).
- C40 (2019).
- C40 (2019).
- Batty et al. (2015, pp. 111-113).
- Su & Zhou (2012).
- Su & Zhou (2012, p. 96).
- Su & Zhou (2012, p. 96).
- Alta Planning & Design (2018).
- Alta Planning & Design (2018, pp. 14-17).
- Gould & Zhou (2010, p. 100).
- Alta Planning & Design (2018, pp. 20-24).
- Alta Planning & Design (2018, pp. 20-24).
- Alta Planning & Design (2018, pp. 28-30).
- Gould & Zhou (2010).
- Gould & Zhou (2010, pp. 101).
- Gould & Zhou (2010, pp. 93).
- Gould & Zhou (2010).
- Cellina et al. (2020).
- Geis & Schulz (2016).
- Cao et al. (2015).
- Alta Planning & Design (2018); Geis et al. (2016); Gould & Zhou (2010).
- Geis & Schulz (2016); Gould & Zhou (2010); Oakil et al. (2016).
- Gould & Zhou (2010).
- Cao et al. (2015); Gould & Zhou (2010); Heinen et al. (2017); Majeed & Batool (2016); Oakil et al. (2016).
- Gould & Zhou (2010).
- Geis & Schulz (2016); Heinen et al. (2017); Oakil et al. (2016).
- Cao et al. (2015).
- Heinen et al. (2017).
- Oakil et al. (2016).
- Geis & Schulz (2016); Oakil et al. (2016).
- Cao et al. (2015).
- Oakil et al. (2016).
- Frei & Gan (2015).
- Cao et al. (2015).
- Frei & Gan (2015).
- Oakil et al. (2016).
- Gould & Zhou (2010).
- Oakil et al. (2016).