2016 Assessment of Idaho's Transportation Infrastructure and Funding
Report Authors
- Greg Hill, Director
- Vanessa Fry, Assistant Director
- Lantz Brown, Graduate Assistant
- Craig Jones, Graduate Assistant
This report was prepared by Idaho Policy Institute at Boise State University and commissioned by Idaho 2020.
Recommended citation: Hill, G., Fry, V., Brown, L., Jones, C. (2016). 2016 Assessment of Idaho’s Transportation Infrastructure and Funding. Idaho Policy Institute. Boise, ID: Boise State University.
Download a printable pdf of this report
Idaho Transportation Infrastructure: Investing for the State’s Economic Viability
Idaho’s transportation system and infrastructure are vital to the state’s economy. Transportation infrastructure can help spur responsible growth in terms of employment, job creation, business retention, and property development. However, Idaho, like most states, is facing critical issues in its transportation system. Declining revenues and escalating debt service will reduce Idaho’s ability to maintain its transportation infrastructure in a state of good repair. Ultimately, without adequate investment in its transportation system, Idaho’s economy and its people will be negatively impacted. Yet Idahoans are not aware of the deteriorating transportation system or the negative consequences of underfunding it. By engaging the citizenry and key transportation stakeholders regarding this issue and offering policy alternatives adopted by peer states, Idaho can move toward instituting dedicated funding sources for transportation infrastructure which is critical to Idaho’s future economic competitiveness and vitality.
Return to the beginning of the report
Well-maintained roads, railroads, airports, transit systems, and ports allow Idaho businesses to manage inventories and transport goods more cheaply, access a variety of suppliers and markets for their products, and get employees to work. Reliable transportation infrastructure also enables consumers and visitors access to Idaho’s businesses and recreational opportunities. In addition, improvements to transportation infrastructure can help catalyze economic growth and positively impact employment, job creation, business retention and property development.
Management and Infrastructure
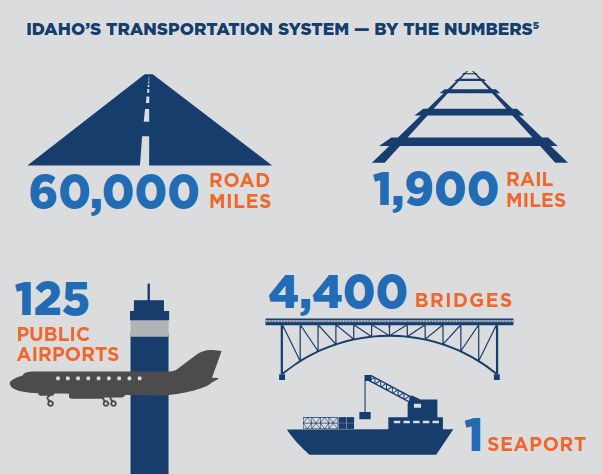
Roadways, bridges, rail lines, airports, and the Port of Lewiston make up Idaho’s multi-modal transportation network. Idaho Transportation Department (ITD) is the main administrative body for this system. ITD’s work involves all modes of transportation that move people and product throughout the state. Its jurisdictional responsibility covers 5,000 miles of highway, more than 1,700 bridges, 30 recreational and emergency airstrips, 30 rest areas, and 10 fixed ports of entry. ITD also oversees federal grants distributed to rural and urban public transportation systems, supports bicycle and pedestrian projects and planning, and provides for state rail planning and development projects. In addition to ITD, the federal government, counties, local highway districts, cities, towns and numerous commissions help manage, fund, and plan for transportation within the state.
Previous Research
Idaho, like most states, is facing critical issues in its transportation system. Declining revenues and escalating debt service will reduce the state’s ability to maintain its transportation infrastructure in a state of good repair; resulting in a deteriorated road, rail and aviation network, inadequate transit network, and a six- to ten-fold increase in repair costs (resulting from neglect and deferred maintenance). A number of studies have been done that demonstrate the state of Idaho’s transportation system, shedding light on the repercussions of underfunding transportation infrastructure for Idaho as well as future transit needs of the state’s rapidly increasing population.
Previous Reports
Idaho Transportation Department Forum on Transportation Investment (2006)
2010 Idaho Highway Cost Allocation Study7
Idaho: Smart Transportation: Save Money and Grow the Economy8
Governor’s Task Force on Modernizing Transportation Funding in Idaho: Final Report (2011)9
Idaho Statewide Freight Study (2013)10
Bureau of Transportation Statistics, State Transportation Statistics 201511
Key Findings of These Reports
- Idaho’s transportation system is experiencing deteriorating infrastructure and an inability to keep up with the demands of a growing population.
- Strategic decisions should be made regarding the prioritization of capital investment (i.e., prioritizing projects with the largest impacts on safety).
- There is need for dedicated funding sources for transportation infrastructure.
The Challenge
Idaho isn’t alone in its challenge to fund the maintenance of existing transportation infrastructure while meeting the demands of population and economic growth. Peer states across the region (Arizona, Colorado, Montana, Nevada, New Mexico, Utah and Wyoming) are facing similar issues, as reported by the American Society for Civil Engineers (ASCE) and illustrated in the table below.12
Table 1: State Report Cards
| Category | ID | Comments | AZ | CO | MT | NV | NM | UT |
|---|---|---|---|---|---|---|---|---|
| Aviation | C | Idaho has more aviation services per capita than most Americans, however, incompatible land uses around airports reduce their function and value. | B- | B+ | N/A | C- | D+ | N/A |
| Bridges | D+ | Many bridges are reaching the limits of their life expectancy. Current funding levels are outpaced by the replacement need. | B | C- | N/A | N/A | C- | B+ |
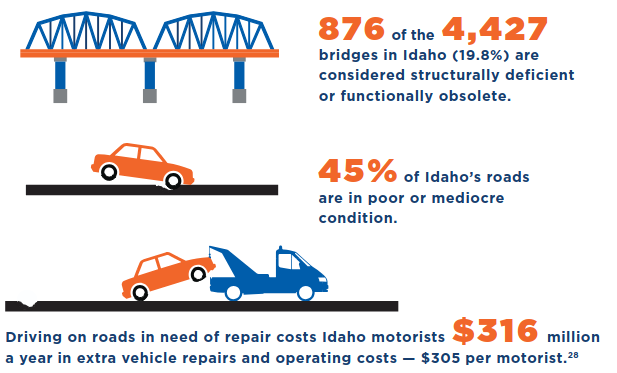
| Roads/State Highways | C-/D | Most of the roads across Idaho meet their capacity needs, but funding shortfalls and limitations will hamper improvements. 45% of Idaho’s roads are in poor or mediocre condition. The existing budget for the state highway system is well below the need and Idaho’s reliance on federal funding will limit the state’s ability to meet future needs. | D+ | D | C | C | C | B+ |
| Transit | D | Transit in Idaho is safe and relatively efficient, but lacks the accessibility and funding to meet the needs. | C+ | D+ | C+ | N/A | C+ | B+ |
| Rail | C+ (Freight) D- (Passenger) |
Private companies continue to invest in rail improvements in Idaho’s critical freight rail system. Passenger rail options are limited across the state. | C+ | N/A | N/A | N/A | C | N/A |
Wyoming did not report on the state’s infrastructure. For other states, N/A appears when a category was not graded.
Idaho is the only state that provides a grade for each category.
Nevada’s report combines roadways, bridges and transit into one category, transportation.
A Gap In Funding
Notably, Idaho’s transportation infrastructure rating tends to be among the lowest in the peer group (per the ASCE report). Part of this may be due to Idaho’s heavy reliance on federal funding, which limits the state’s ability to meet both current and future transportation needs. Construction, operation, and maintenance of transportation systems is typically funded by a number of sources including federal and state grants, cooperative agreements, loans, and revenue sources (e.g., gas taxes, registration fees, etc.). Innovative financing arrangements, such as leases and public-private partnerships, have also been used to fund the procurement of materials and other activities. The ASCE report also indicates that states, such as Utah, with more diversified revenue sources, and less dependence on federal funding, tend to have better transportation infrastructure. Ultimately without adequate investment in its transportation system, Idaho’s economy and its people will be negatively impacted.
Current funding levels are running far short of needs. Over the next 20 years, it is estimated that there will be a $3.6 billion funding shortfall if new revenues are not identified and pumped into the system. This will lead to a rapidly deteriorating local highway system, and ultimately leave the local highways in an unusable and unsafe condition. These conditions could be catastrophic if nothing is done to augment the funding system.13
Return to the beginning of the report
Freight
Trucks carry more than 150 million tons of freight (worth $80.5 billion) each year on Idaho roads.1
Aviation
Civil aviation in Idaho contributes to $2.7 billion in economic activity in the state and provides directly for over 13,500 jobs.3
Tourism
Idaho’s multimodal transportation system enables a $2.7 billion tourism industry.2
Workforce
650,000 Idahoans rely on a well-maintained system of roads and bridges to travel to work each day.4
Business
Idaho manufacturers annually ship more than $15 billion in products within the state.4
Return to the beginning of the report
Idaho’s economy depends on a high quality, multi-modal transportation network. Transportation infrastructure investment has been proven to increase a state’s economic productivity. A well-developed transportation network can enhance job accessibility, reduce accident rates, and save time and money for employees commuting to work and therefore improve the quality-of-life features that make an area attractive to both employers and workers. This is especially critical for economically disadvantaged regions where improved infrastructure can reduce high production and transaction costs, which occur in much of rural Idaho. Infrastructure investment also can raise property values, particularly if these investments lead to the expected improvements in local living standards (including shorter commute times and greater proximity to desirable amenities). In fact, studies indicate that property values experience a premium effect when located near public transit systems.18
Benefits of Transportation Infrastructure Investment
- More reliable shipments and travel times
- Higher land values
- Increased local economic development
- Employment growth
- Increased health and safety
- Less road congestion
- Lower household costs
- Reduced vehicle operating and maintenance costs
- Decreases income inequality
Idaho’s roadways provide for the majority of the state’s transportation infrastructure (in both capital investment and miles traveled by goods and people). However, aviation, freight infrastructure, and public transit also play important roles.
In addition to providing connectivity and increased accessibility, aviation is important to Idaho’s economic performance. It supports economic output, attracts business and tourism, supports local economic development, and retains jobs that might otherwise relocate. 42% of the state’s economy is comprised of Idaho’s freight intensive industries (e.g., agriculture, manufacturing, forestry, etc.).20 These industries rely on airports, rail, highways, and the Port of Lewiston to deliver goods within the state, across state lines, and to international destinations. Rail is a critical component of Idaho’s freight system for hauling bulk commodities, including agricultural products, basic chemicals (serving the food processing, wood, and chemical industries), fertilizers, cereal grains, and other agricultural products. Finally, Public transportation provides over 4 million passenger trips each year in Idaho.21 Transit enables riders to pay a smaller percentage of their household income towards transportation costs and increases economic and social opportunities for residents and visitors who are economically, physically and socially disadvantaged.22
An efficient rail system can help to lower the cost of consumer goods to Idaho’s residents by reducing travel times, adding capacity, potentially reducing future maintenance needs on the highway network, and/or by increasing the reliability of on-time shipments.23
No-Action Consequences
Improving the way Idaho funds public investment in transportation infrastructure is critically important for the state. With a projected shortfall of $3.6 billion over the next 20 years, current funding levels are inadequate to maintain or expand Idaho’s infrastructure.24 Annually, Idaho needs an additional $155 million dollars per year for operations and maintenance and an additional $207 million dollars per year for capacity improvements.25 The declining quality and poor performance of public transportation infrastructure systems impose significant costs on businesses and individuals and create bottlenecks that constrain economic development (ASCE 2013).26 Deferred maintenance of highways and bridges, due to inadequate funding and/or inefficient project prioritization, can lead to increased risk of accidents and even catastrophic infrastructure failures. Inadequate transportation infrastructure also can result in direct costs to Idahoan’s through vehicle repairs (e.g., damaged tires and suspensions) due to travel on roadways and bridges in need of repair and operating costs associated with congested travel, which also leads to reduced fuel efficiency.27
Underfunding of infrastructure also can lead to an often unacknowledged consequence for state governments: increased risk of a credit rating downgrade. As emphasized by all three major US credit rating agencies, the economic base is a key factor in determining municipal bond ratings. Job creation, income growth, and sustained economic development provide reasonable assurance that a bond issuer will be able to generate enough future revenue to repay its debt obligations, thereby enhancing the issuer’s creditworthiness. Through the linkage between infrastructure and a state’s debt and economy, large infrastructure deficits in quantity and/or quality may increase borrowing and limit the government’s ability to generate the necessary income to cover its debt. In addition, the poor condition of a state’s transportation infrastructure may reflect that state government’s inferior performance and inability to properly manage public assets.
Invest Now, Save Later
A recent International Transport Forum report states that “deferring maintenance can make roadway costs much greater than indicated by current expenditures.”29 Supporting this finding, the American Association of State Highway and Transportation Officials (AASHTO) reports for every $1 spent to keep a road in good condition $6-14 are needed later to rebuild the same road if it has deteriorated.30 Despite this, transportation projects typically have been funded on a ‘pay-as-you-go’ basis due to the need to use revenue (primarily from a combination of federal grants and state and local taxes) to provide capital for a project.
Pay-as-you-go means that projects tend to be built over the course of several years as the revenue becomes available. This often delays construction on critical pieces of transportation infrastructure, ultimately making the repair more costly. According to the Federal Highway Administration, “While the pay-as-you-go approach (conventional financing) has the benefit of simplicity and avoids interest costs associated with indebtedness, it involves the hidden costs associated with inflation and foregone economic development, especially for projects delayed several years. In addition, delaying projects that reduce emissions or eliminate safety hazards also has obvious negative political and economic effects.”31 To ensure more timely completion of projects some states have turned to financing strategies in order to access all necessary capital at the onset of a project.
States’ use of innovative financing techniques has resulted in projects being constructed more quickly than they would otherwise be under traditional pay-as-you-go financing. Financing has been used to address traditional infrastructure projects, such as for highways and bridges, and to support public transit. For example, using debt financing, rather than pay-as-you-go, enables transit agencies to more quickly improve short-term cash flow and match project funding with the useful life of assets.33 Faster project delivery also can strengthen revenue generation in transit projects through increased ridership and reduced maintenance costs by retiring older, less reliable equipment. By prioritizing projects and having capital on hand to complete them, states are able to more proactively to address issues with infrastructure and, ultimately, spend less and incur savings in the long run.
Idaho’s use of the Grant Anticipation Revenue Vehicle (GARVEE) program is a case in point. GARVEE bonds, an innovative highway bonding process, allowed Idaho to invest $857.6 million in highway improvement projects over a ten-year period, which funded, according to ITD Director Brian Ness, “. . . necessary improvements [that] would have taken 30 years under the existing pay-as-you-go method. But,” Ness added, “[Idaho] could not afford to wait — communities were growing, highway congestion was increasing and the funding options to improve Idaho’s transportation system were limited.”34 However, the GARVEE program in Idaho ended in 2015, necessitating a closer look into future funding and financing scenarios.
With Challenges Come Opportunities
By creating a strategy that permits more flexibility regarding infrastructure financing mechanisms, the challenge of fiscal stress can act as an opportunity to create a more flexible funding alternative.35 The transportation funding issue in Idaho, if viewed as an opportunity, can allow decision makers to think creatively and generate strategies that will both address the problems at hand and alter the way funding, as a whole, is considered. ITD has already moved in this direction in recognizing a sound infrastructure investment is one that ensures existing infrastructure is maintained in a state of good repair.36,37 However, If Idaho does not meet the increasing demand for transportation throughout the state, Idaho will be unable to be as competitive in the marketplace, the economy may be weakened, and the overall quality of life for the state residents will decrease.38 In order to remain competitive, Idaho can learn from the best practices of regional peer states regarding project prioritization process and funding strategies.
Return to the beginning of the report
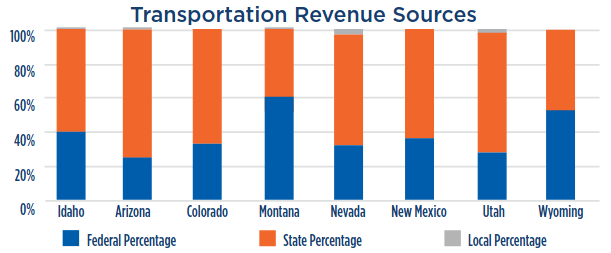
States typically finance construction, operation, and maintenance of transportation systems with a combination of federal, state, and local funding. Of the federal funding received by state departments of transportation, nearly 93% is through formula programs. The rest is allocated though discretionary grant programs, which are competitive in nature. The chart below compares Idaho to seven neighboring states: Arizona, Colorado, Montana, Nevada, New Mexico, Utah, and Wyoming. Of note, due to the federal funding formulas, both Montana and Wyoming receive the highest portion of federal dollars, while Arizona and Utah are at the bottom.
Universal Funding
All peer states are using two types of funding alternatives: fuel tax and vehicle registration fees. These traditional methods of funding are not sufficient to maintain the growing demands. Due to increased fuel efficiency and alternative fuel vehicles, states have seen a continual drop in fuel tax revenue, while at the same time seeing an increase in vehicles on the road. These are important dedicated funding streams, yet they sustain the pay-as-you-go philosophy and have contributed to the challenges Idaho faces today.
Conventional Funding
This set of alternatives are considered “conventional” because a majority of Idaho’s peer states are employing them. However, Idaho’s use of them is limited to just bonding for revenue through the Idaho Housing and Finance Administration for the GARVEE bonds, impact fees, and other sources such as special plates, etc. There are many more alternatives that other states are doing.
Non-Conventional Alternatives
The third set of alternatives is categorized as non-conventional because the usage is limited to a handful of states or the alternatives have not yet been implemented, but studies suggest that there are promising results. Increased funding is not the only option for policymakers. States are also seeking to reduce the need for additional revenue. Cost-saving strategies enhanced project prioritization, performance measures, demand reduction techniques, as well as balancing the need to maintain existing roads with the desire to build new capacity. In addition, innovative partnerships and land use development techniques have led to reduced costs. Listed below are more in-depth discussions of revenue and non-revenue alternatives utilized by other states.
| Highway | Transit | Freight/Passenger Rail | |
|---|---|---|---|
| Universal Funding Sources |
|||
| Fuel Tax | AZ, CO, ID, MT, NM, NV, UT, WY | ID, MT, NM | ID, NM |
| Registration Fees | AZ, CO, ID, MT, NM, NV, UT, WY | ID, MT, NM | NM |
| Conventional Funding Sources |
|||
| Gas Tax | NM | NM | NM |
| Vehicle Sales Tax (purchase and/or rental) | AZ, MT, NM, NV, UT | NM | NM |
| Vehicle or Truck Weight Fees | AZ, CO, MT, NM, NV, UT, WY | NM | NM |
| Tolls | CO | ||
| General Funds | CO, NV, WY, UT | AZ, WY | |
| Interest Income | AZ, CO, MT, NM, NV, UT, WY | NM, WY | |
| Sales Tax | CO, UT | NM | |
| Bonding (general obligation) | NM, NV, UT | ||
| Bonding (revenue) | AZ, CO, ID, NM, NV, UT | NM | NM |
| Other Sources – oversized permit fees, special plates, etc.) | AZ, NV, WY | MT, WY, ID | NM |
| Lottery | AZ | ||
| Impact Fees | AZ, CO, ID, MT, NM, UT | ||
| Non-Conventional Alternatives |
|||
| Local Option Gas Tax | MT, NV, NM | ||
| Local Option Sales Tax | AZ, CO, NV, NM, WY, UT | AZ, CO, NV, NM, UT | |
| Local Option License/Registration Tax | MT, ID, NV, CO | ||
| Other Local Option Taxes | NV, CO, ID | ||
| Dedicated Property Tax | AZ, CO, ID, NV, WY | ||
| Vehicle Miles Traveled Fees | Currently being studied in a number of states, including CO, NV, and UT | ||
| Public-Private Partnerships | AZ, CO, NV, UT | ||
| Tax Increment Financing | Montana is experimenting with this. | ||
| Transportation Utility Fees | Montana is also experimenting with this. |
Local Option Taxes
In some form or another, all of Idaho’s peer states employ local option taxing authority as an alternative stream of funding. According to the Federal Highway Administration, local option taxes or fees that have become increasingly popular for supporting local transportation investment, especially for transit projects.39 Local option taxes allow states and communities the ability to deal with transportation funding challenges at the community level. In 2015, Utah passed HB 362, which, among many other transportation related innovations, allows counties to vote on a local option tax for transit development.
Vehicle Miles Traveled Fees (VMT)
Idaho’s population has increased steadily over the past two decades and there are more cars on Idaho’s roads than ever before, yet the fuel tax revenues are not keeping up with needs. Fuel efficiency standards are increasing and alternative fuel vehicles are becoming more prevalent, thus revenue per vehicle mile traveled is going down. In an effort to deal with the loss of revenue many states are looking at a Vehicle Miles Traveled (VMT) fee to replace the traditional fuel tax. Some of Idaho’s peer states are investigating the costs and benefits of VMT fees. Oregon has started a voluntary program,40 Nevada has completed a multi-year study,41 and there is currently a federal pilot program operating out of the University of Iowa.42 The studies suggest that replacing the fuel tax with a VMT fee will provide a stable, dedicated revenue stream that is both effective and efficient. For example, Nevada recommends replacing its gas tax with a 3.3 cents/mile fee. In Idaho, the 2011 Governor’s Task Force, after considering the strengths and challenges of twelve potential sources of revenue, recommended the implementation of a mileage and use-based system like VMT to the extent possible with current technology, privacy issues, and public acceptance.43
VMT faces some challenges that the fuel tax does not. First, the capital cost of implementation of the collection methods would be very high. In addition, how do governments measure it? Are drivers charged only for miles traveled on in-state roads? If yes, how will it be tracked? How can we manage privacy issues? Many of the ongoing studies are wrestling with these challenges, including Colorado and Utah.
Peer States Best Practices:
Arizona:
- Highway User Revenue Fund (traditional funding sources)
- Local Transportation Assistance Fund in Maricopa County, funded by Powerball
- Large county local option taxing authority (Arizona Regional Area Fund)
Nevada
- AB 595 earmarking room, car rental and portions of the property taxes to highway construction
- “Pioneer Program” – an advisory panel to study P3s
- Studying availability payment programs to pay back road builders/operators based on road usage
- Studying Vehicle Miles Traveled fee to replace gas tax
Colorado
- SB 228 ties money transfers for transportation to personal income growth
- Raised registration fees to approximately $6/month/vehicle owner
- P3 to build, manage, and maintain Boulder Turnpike
- Proposing: dedicated sales tax, road-usage charge, more toll roads
Utah
- Raised Gas Tax to a 12% assessed rate
- Raised diesel and natural gas tax to 16 cents/gallon
- Studying road-usage charge revenue system
- Local option tax for counties to fund local projects
- State sales tax from auto-related sales
- Centennial Highway fund available
- Envision Utah P3
Public-Private Partnerships (P3S)
Public-private partnerships, defined as “contractual agreements formed between a public agency and a private entity that allow for greater private sector participation in the delivery and financing of transportation projects,”44 are becoming more commonplace in the provision of public services. As of January 2016, 33 states have enacted legislation enabling P3s.45 Amongst Idaho’s peer states, Arizona, Colorado, Nevada, and Utah all have some level of enabling legislation that allows for P3s.46
The benefits of P3s are that states can leverage the private sector’s expertise and resources (skills, financing and enhanced quality). The primary concern is loss of public control, private profit at public expense, loss of future revenue, risk of bankruptcy or default, and concerns over transparency and accountability. Each state, with the exception of Nevada, requires state legislative approval, review, or other type of involvement to address these concerns. A National Conference of State Legislatures report lists the types, conditions, and legislative legitimacy of each state’s P3 plan.47 Colorado entered into a public-private partnership in 2014 that gives Plenary Roads Denver, a private company, control over the Boulder Turnpike. Plenary Roads Denver will expand the Turnpike (a $425 million project), operate, and maintain the Turnpike. In exchange, the company will retain all of the revenues from the tolls for 50 years.
The Utah Transportation Coalition, the Salt Lake Chamber of Commerce, and the Governor’s office are great examples, as is the commitment by the Gardner Company to invest in the Salt Lake City airport, which currently operates debt free with approximately $400 million of cash on hand)53 that transportation is an investment opportunity that needs to be managed aggressively. Utah also has the second lowest reliance on federal dollars than any of the peer states at 28% (Arizona is at 25%).
Tax-Increment Financing (TIF)
Tax increment financing dedicates funds from a geographically defined district or region with a roadway project.48 The increase in tax revenue (post-investment “increment”) generated by the roadway investment is used to pay off the bonds. A study by the Texas A&M Transportation Institute49 argues that tax increment financing is a way to deal with the ever-increasing costs of transportation construction and ever-decreasing revenues from fuel taxes, and helps provide additional funding for transportation. Further, it reduces the need to borrow. One of the challenges of using a TIF is that it is a non-user tax, which can be politically unpopular. Also, revenues can be affected by swings in the economy. Currently, there are three projects in Texas using tax increment financing: City of El Paso, City of Forney, and Hidalgo County. Idaho has authority to implement TIFs at the local level. Twins Falls used its urban renewal district as a TIF when Chobani was looking to relocate. Tax increment financing is helpful at the local level, but does not address the systemic needs of the system.
Transportation Utility Fees
A transportation utility fee is “a monthly fee based on use of a transportation system. Fees are typically assigned proportionately to road usage based on land use generation, trip intensity, vehicle miles traveled, or a flat rate.”50 Montana is currently investigating transportation utility fees as an additional funding mechanism. The fee acts like any other utility bill a property owner would pay, and it is collected through the regular utility bill. At this time, road use is estimated, and Montana is hoping this will reduce the overall vehicle miles traveled as well as incentivize compact and/ or mixed use development. As with TIFs, some Idaho cities have employed transportation utility fees. Homedale used it for upgrades to its main street. Again, the challenge is that transportation utility fees are localized, and do not address Idaho’s challenges systematically.
Special Assessment Fees
Special assessment fees are used to pay off bonds that benefit a specific beneficiary. All of Idaho’s peer states allow for
special assessment fees, however, Idaho’s policies are the most restrictive.51
Transit Oriented Development (TOD)
Transit oriented development is a type of community planning that creates a walkable, compact, mixed use environment. TODs are designed to minimize the use of private vehicle ownership and, thus, reduce the need for road maintenance, and gas consumption. According to the Transit Oriented Development Institute, TODs can reduce driving by up to 85%.52 Denver, CO, is building 119 miles of light rail and 70 new stations that increase opportunities around that region for TODs.
Civic and Private Community Engagement
Civic and private community engagement is a commitment to a cultural shift in the transportation funding mindset. Of the states included in this study, Utah seems to be the one leading the way on innovative thinking, planning and funding with respect to transportation. Utah is the only one of the peer states to receive a grade above a C by the American Society of Civil Engineers (B+), suggesting a commitment to transportation infrastructure as a tool of economic development. Transportation organizations in Utah have worked closely with both governmental and nongovernmental partners to create a culture of “invest now, save later.” Utah is a standout state amongst Idaho’s peers that has shown evidence of engaging and convincing stakeholders.
Table 3: Universal Highway Funding Sources
| State | Fuel Tax | Registration Fees |
|---|---|---|
| Idaho | X | X |
| Arizona | X | X |
| Colorado | X | X |
| Montana | X | X |
| New Mexico | X | X |
| Nevada | X | X |
| Utah | X | X |
| Wyoming | X | X |
Table 4: Conventional Highway Funding Sources
| State | Gas Tax | Vehicle Sales Tax | Weight Fees | Tolls | General Funds | Interest Income | Sales Tax | Bonding (general obligation) | Bonding (revenue) | Other Sources | Lottery | Impact Fees |
|---|---|---|---|---|---|---|---|---|---|---|---|---|
| Idaho | X | X | ||||||||||
| Arizona | X | X | X | X | X | X | ||||||
| Colorado | X | X | X | X | X | X | ||||||
| Montana | X | X | X | X | ||||||||
| New Mexico | X | X | X | X | X | X | X | |||||
| Nevada | X | X | X | X | X | X | X | |||||
| Utah | X | X | X | X | X | X | X | |||||
| Wyoming | X | X | X | X |
Table 5: Unconventional Highway Funding Sources
| State | Local Option Gas Tax | Local Option Sales Tax | Local Option License/Registration | Other Local Option Tax | Dedicated Property Tax | Public-Private Partnerships |
|---|---|---|---|---|---|---|
| Idaho | X | X | X | |||
| Arizona | X | X | X | |||
| Colorado | X | X | X | X | X | |
| Montana | X | X | ||||
| New Mexico | X | X | ||||
| Nevada | X | X | ||||
| Wyoming | X | X |
Note: to view the full tables, please download the pdf version of the report.
Return to the beginning of the report
Idaho is not alone in its struggle to maintain transportation infrastructure. Each of its peer states are trying to cope with deteriorating infrastructure, decreased revenue from dedicated fund sources, and inconsistent commitments from federal sources. As noted, there are many ways that states can fund transportation infrastructure. One thing that stands out is that when compared to its peer states, Idaho uses by far the fewest number of options, in effect limiting the vision and opportunities that surround transportation funding. Many of Idaho’s peer states have implemented innovative funding solutions. Others are investigating ideas. It is clear from this analysis that there are many ways to approach this pressing public problem. It seems, legislatively, that Idaho has boxed itself in with respect to its ability to be innovative and non-conventional when it comes to the universe of policy alternatives that exist. As evidenced in a recent article in the New York Times, states are recognizing the federal government’s limitations on funding transportation infrastructure, and thus are looking inward for policy solutions. In fact, there are public transportation bills worth over $200 billion dollars on the November 2016 ballot. Utah, Colorado, and Arizona are listed as states leading the way.54
Finally, one of the main challenges for Idaho, aside from the actual financial shortfall dilemma, is helping the citizenry recognize transportation infrastructure funding is a major problem. Recent surveys statewide and in the Treasure Valley have identified jobs, the economy and education as the main issues facing Idaho. Those surveys also noted those issues as the top priorities that the Idaho legislature should address. Transportation barely registered on either of these scales. However, jobs, economy, and education are inexorably linked to transportation and the infrastructure needed to support them. As Idaho 2020 considers the alternatives listed in this report, we recommend that at least part of the effort be devoted to informing the public on the state of Idaho’s transportation system, and how transportation and jobs work together to make Idaho’s economy strong.
Many organizations in Idaho are working hard to preserve Idaho’s transportation system. From Metropolitan Planning Organizations to local leaders to the ITD, each group has a commitment to excellence. By engaging the citizenry and key transportation stakeholders regarding this issue and offering policy alternatives adopted by peer states, Idaho can move toward instituting new and innovative dedicated funding sources for transportation infrastructure that is vital to Idaho’s future economic competitiveness and vitality. It is our hope that this report will provide decision makers with alternatives that may not yet have been considered or realized, and help frame the debate as Idaho lawmakers tackle this important public policy.
Return to the beginning of the report
- Idaho Transportation Planner (2015). http://www.itd.idaho.gov/newsandinfo/Docs/idaho_funding_primer.pdf
- Bureau of Transportation Statistics. (2015). State Transportation Statistics 2015. Data is from 2013.
- Federal Aviation Administration. (2015). The Economic Impact of Civil Aviation on the U.S. Economy. U.S. Department of Transportation. https://www.faa.gov/air_traffic/publications/media/2015-economic-impact-report.pdf
- Governor’s Task Force On Modernizing Transportation Funding In Idaho. (2011). Final Report. https://itd.idaho.gov/Publications/Task_Force_Final_Report_Low_Res.pdf
- Numbers are approximate. Idaho Transportation Department. (ITD) (2016). Idaho’s Transportation System Defined. http://itd.idaho.gov/aboutitd/oversyst.htm
- Smart Growth America. (2011). Idaho Smart Transportation: Save Money and Grow the Economy.
- Balducci, P., Mingo, R., Wolff, H., Stowers, J., and Cohen, H. (2010). 2010 Idaho Highway Cost Allocation Study. Transportation Research Board. https://trid.trb.org/view.aspx?id=1100608 and presentation at http://slideplayer.com/slide/5029880/
- Smart Growth America. (2011). Idaho Smart Transportation: Save Money and Grow the Economy.
- Governor’s Task Force On Modernizing Transportation Funding In Idaho. (2011). Final Report. https://itd.idaho.gov/Publications/Task_Force_Final_Report_Low_Res.pdf
- David Evans and Associates, Inc. (2013). Idaho Statewide Freight Study. Idaho Transportation Department.
- U.S. Department of Transportation, Office of the Assistant Secretary for Research and Technology, Bureau of Transportation Statistics, State Transportation Statistics 2015, Table 1-7 http://www.rita.dot.gov/bts/sites/rita.dot.gov.bts/files/publications/state_transportation_statistics/state_transportation_statistics_2015/chapter-1/table1_7
- American Society of Civil Engineers (ASCE). (2013). 2013 Report Card for American’s Infrastructure. http://www.infrastructurereportcard.org/ ASCE evaluated state’s transportation infrastructure on the basis of capacity, condition, funding, future need, operation and maintenance, public safety, resilience, and innovation.
- American Society of Civil Engineers (ASCE). (2013). 2012 Report Card for Idaho’s Infrastructure.
- Bhatta, S. & Drennan, M. (2003). The Economic Benefits of Public Investment in Transportation: A Review of Recent Literature. Journal of Planning Education and Research, Vol. 22, pp. 288-296.
Garcia-Mila, Teresa, & McGuire, Therese J. (1992). The Contribution of Publicly Provided Inputs to States’ Economies. Regional Science and Urban Economics 22:229–41.
Munnell, Alicia H. (1990). How Does Public Infrastructure Affect Regional Economic Performance? In Is There a Shortfall in Public Capital Investment? edited by Alicia H. Munnell, 69–103. Boston, MA: Federal Reserve Bank of Boston. - Aschauer, David Alan. (1990). Highway Capacity and Economic Growth. Economic Perspectives 14:14–24.
- Gannon C., Liu Z. (1997). Poverty and Transport. The World Bank, Mimeo.
- Haughwout, Andrew F. (2002). Public infrastructure investments, productivity and welfare in fixed geographic areas. Journal of Public Economics, 83(3): 405-428.
- Weinstein, B. et al. (1999). The Initial Economic Impacts of the DART LRT System. Center for Economic Development and Research, University of North Texas.
Garrett, T. (2004). Light Rail Transit in America: Policy Issues and Prospects for Economic Development. Federal Reserve Bank of St. Louis.
Gruen, A. (1997). The Effect of CTA and METRA Stations on Residential Property Values. Regional Transportation Authority.
Landis, J. et al. (1995). Rail Transit Investments, Real Estate Values, and Land Use Change: A Comparative Analysis of Five California Rail Systems. Institute of Urban and Regional Development, UC Berkeley.; Cervero, R. et al. (2002). Land Value Impacts of Rail Transit Services in San Diego County,” Urban Land Institute. - National Economic Council. (2014). An Economic Analysis of Transportation Infrastructure Investment.; McNichol, Elizabeth. (2016). It’s Time for States to Invest in Infrastructure. Center on Budget and Policy Priorities.
- David Evans and Associates, Inc. (2013). Idaho Statewide Freight Study. Idaho Transportation Department.
- Idaho Transportation Department. (2014). 3rd Annual Public Transportation Performance Report 2014.
- Center for Transportation Studies. (2010). How Transit Improves Job Access for Low-Wage Workers: A Transitway Impacts Research Program Research Brief. Center for Transportation Studies, University of Minnesota.
- Idaho Transportation Department. (2013). Idaho Statewide Rail Plan.
- American Society of Civil Engineers (ASCE). (2013). 2012 Report Card for Idaho’s Infrastructure.
- Governor’s Task Force On Modernizing Transportation Funding In Idaho (2011). Final Report. https://itd.idaho.gov/Publications/Task_Force_Final_Report_Low_Res.pdf
- AASHTO. (2009). Road condition and automobile repair costs:, Rough Roads Ahead: Fix Them Now or Pay for Them Later. http://roughroads.transportation.org/
- Bureau of Transportation Statistics. (2015). State Transportation Statistics: Road Bridge Conditions. ; American Society of Civil Engineers (ASCE). (2013). 2012 Report Card for Idaho’s Infrastructure.
- Crist, Phillippe, Kauppila, Jari, Vassallo, Jose & Wlaschin, Butch. (2013). Asset Management for Sustainable Road Funding. OECD, International Transport Forum Discussion Paper No. 2013-13.
- AASHTO. (2009). Rough Roads Ahead: Fix Them Now or Pay for Them Later. http://roughroads.transportation.org/
- Federal Highway Administration (2016). Innovative Finance Support: Frequently Asked Questions. U.S. Department of Transportation. http://www.fhwa.dot.gov/ipd/finance/faqs
- Government Accountability Office. (2002). GAO-02-1126T: Transportation Infrastructure: Alternative Financing Mechanisms for Surface Transportation.
- Transportation Research Board. (2003). Transit Cooperative Research Program Report 89: Financing Capital Investment: A Primer for the Transit Practitioner. Washington, D.C.
- Ness, Brian. (2016). Idaho’s Grant Anticipation Revenue Vehicle program transforms state’s infrastructure. Government Technology Magazine.
- Pisano, Mark. (2016). How Research Can Drive Policy: Econometrics and the Future of California’s Infrastructure. Public Administration Review Vol. 76, Issue 4.
- Kahn, Matthew and Levinson, David. (2011). Fix It First, Expand It Second, Reward It Third: A New Strategy for America’s Highways. Hamilton Project.; Gramlich, Edward M. (1994). Infrastructure Investment: A Review Essay. Journal of Economic Literature, 32(3): 1176–1196.
- Krause, John. (2016). FY 2017 Program Update Packet for the Idaho Transportation Investment Program. Idaho Transportation Department.
- Governor’s Task Force On Modernizing Transportation Funding In Idaho (2011). Final Report. https://itd.idaho.gov/Publications/Task_Force_Final_Report_Low_Res.pdf
- U.S. FHWA. Non-Road Pricing Revenue: Sources and Tools. http://www.fhwa.dot.gov/ipd/revenue/non_pricing/sources_tools/local.aspx
- http://www.myorego.org/
- Paz, et. Al. (2014). Assessment of Economic Impacts of Vehicle Miles Traveled Fee for Passenger Vehicles in Nevada. Transportation Research Record: Journal of the Transportation Research Board.
- http://www.fhwa.dot.gov/ipd/revenue/road_pricing/defined/vmt.aspx
- Governor’s Task Force On Modernizing Transportation Funding In Idaho. (2011). Final Report. https://itd.idaho.gov/Publications/Task_Force_Final_Report_Low_Res.pdf
- The Office of Innovate Project Delivery. (n.d.) P3 Defined. FHA, Washington, DC. www.fhwa.dot.gov/ipd/p3/defined
- Pula, Kevin. 2016. Public-Private Partnerships for Transportation. National Conference of State Legislatures. http://www.ncsl.org/Portals/1/Documents/transportation/P3_state_statutes.pdf
- Pula, Kevin. 2016. Public-Private Partnerships for Transportation” National Conference of State Legislatures. http://www.ncsl.org/Portals/1/Documents/transportation/P3_state_statutes.pdf
- Note, the NCSL recommends that P3s do not act as the funding source. Rather, P3s can provide additional financing opportunities that can lead to cost savings.
- Idaho 2020. (2016). Infrastructure Investment and Economic Development in Idaho.
- Texas A&M Transportation Institute. (2012). Mobility Investment Priorities. Texas A&M. http://d2dtl5nnlpfr0r.cloudfront.net/tti.tamu.edu/documents/TTI-2012-12.pdf
- http://www.mdt.mt.gov/research/toolkit/m1/ftools/fd/tuf.shtml
- Idaho 2020. (2016). Infrastructure Investment and Economic Development in Idaho.
- www.tod.org
- http://gardner.utah.edu/2015/02/flight-plan-utah-quite-possibly-has-the-best-airport-in-the-country/
- New York Times. Nov 2016. http://www.nytimes.com/2016/10/30/opinion/sunday/waking-up-to-shorter-commutes.html?smid=pl-share&_r=0