Angela N. Malliaras, Dr. Dylan Mikesell, Dr. Joe Champion, Dr. Sergio Arispe
Characterizing Cattle Behavior in the Rugged Rangeland of SE Oregon Using Low-Cost GPS Collars
Introduction
- High desert rangelands in southeastern Oregon are rugged and present variable terrain in the sage steppe
- Cattle grazing is commonly implemented to promote functionally healthy landscapes and support rangeland-based businesses
- Little is known about individual cattle behavior on range.
Study Objectives:
- This study aims to characterize individual cattle behavior on rangelands in southeastern Oregon using low-cost i-gotU GT-120 GPS collars
- Compare group & individual behaviors between seasons
Methods
Location
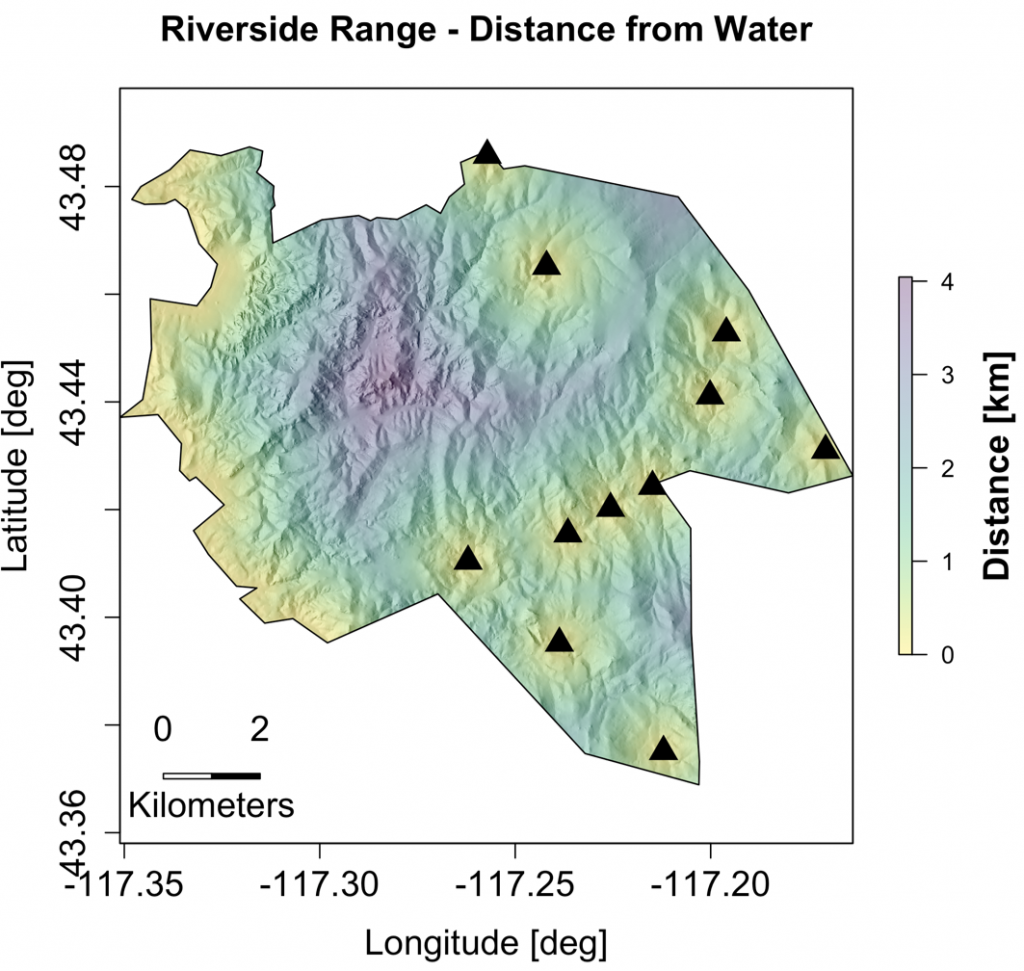
- The study took place 80 km west of Boise, ID, on the Vale District Bureau of Land Management Three Fingers Allotment in Malheur County, OR.
- (43.432°,- 117.228°)
- Elevation ranged from 1050 m – 1700 m.
Cows
- 10 crossbred (Angus Charolais x Hereford), commercial cows from spring (March 15-April 15, 2018)
- 10 commercial cows from fall (October 24-November 24, 2019
Variables of Interest
- Slope
- Elevation
- Distance to water
Cows split into groups
- Fall
- Spring
GPS Collars
- i-gotU GPS GT-120 collars were used; position logged at 10-minute interval
- Data were cleaned using Animal Tracker package in R
- Clean data was plotted and analyzed in RStudio
Results
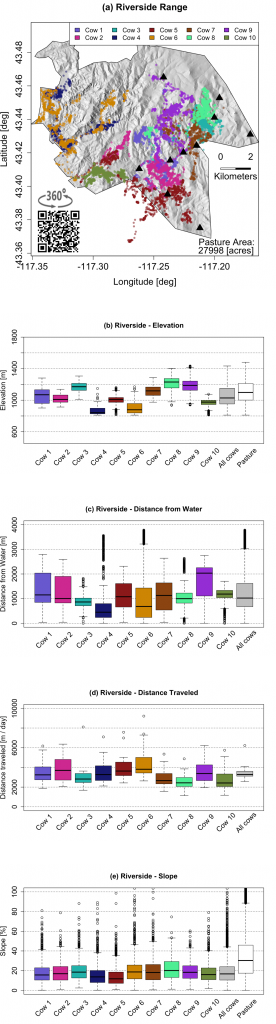
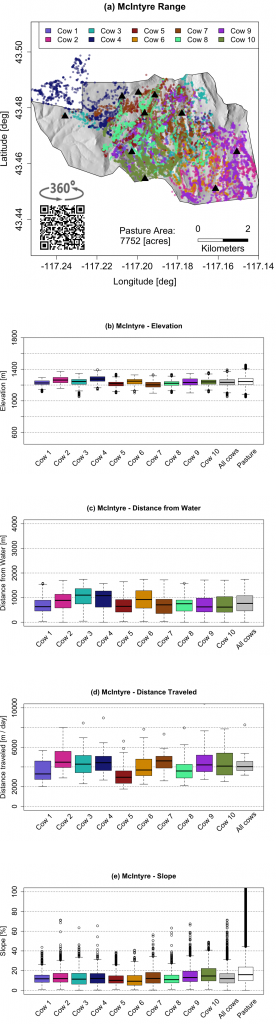
Seasonal variability influences individual cattle behavior on rangeland landscape,
Conclusion
- Overall, the slope percentage and elevations were more variable throughout the Riverside pasture (spring).
- Spring cows utilized the elevation and slope percent more than the fall cows. This could be attributed to the pasture terrain but also because spring has more food sources throughout the pasture compared to fall.
- Fall cows averaged larger daily travel distances compared to spring cows; this could be related to preferred food being more spread out across the range.
- Spring cows traveled farther away from water sources than fall cows; this could be due to higher moisture in forage during the spring season.
- Spring individuals showed the most variability between one another compared to fall cows; this is a point of interest to explore further to explain individual cow preference.
Future Studies
- Because these pastures are different, data collection on cows within the same pasture across a season we might be able to explore more directional correlations between behavior and seasons.
- Data on genetics of individuals may reveal explanations for individual terrain use.
Acknowledgements
This research was partially funded by the Oregon State University Agricultural Research Foundation.
Additional Information
For questions or comments about this research, contact Angela Malliaras at angelamalliaras@u.boisestate.edu.