Samuel McMurdie, Brielle Ibe, Michael Reynolds, Dr. Mike Hurley, Hitesh Trivedi
Introduction
Seawater corrosion remains a constant challenge for any metal-based components expected to be used in or near marine environments. Corrosion in less visible components, such as bearings, can be troublesome as their degradation is not easily noticed until engine system performance is reduced or parts begin to fail. This work was conducted to investigate the effect of surface and heat treatments on the corrosion resistant properties of 13% Cr carburizable martensitic stainless steel (UNS 42670) through polarization testing and electrochemical impedance spectroscopy (EIS). Processing treatments considered include carburizing, carbonitriding and final annealing temperature. Samples of other aerospace bearing steels were tested for comparison.
Experimental Setup
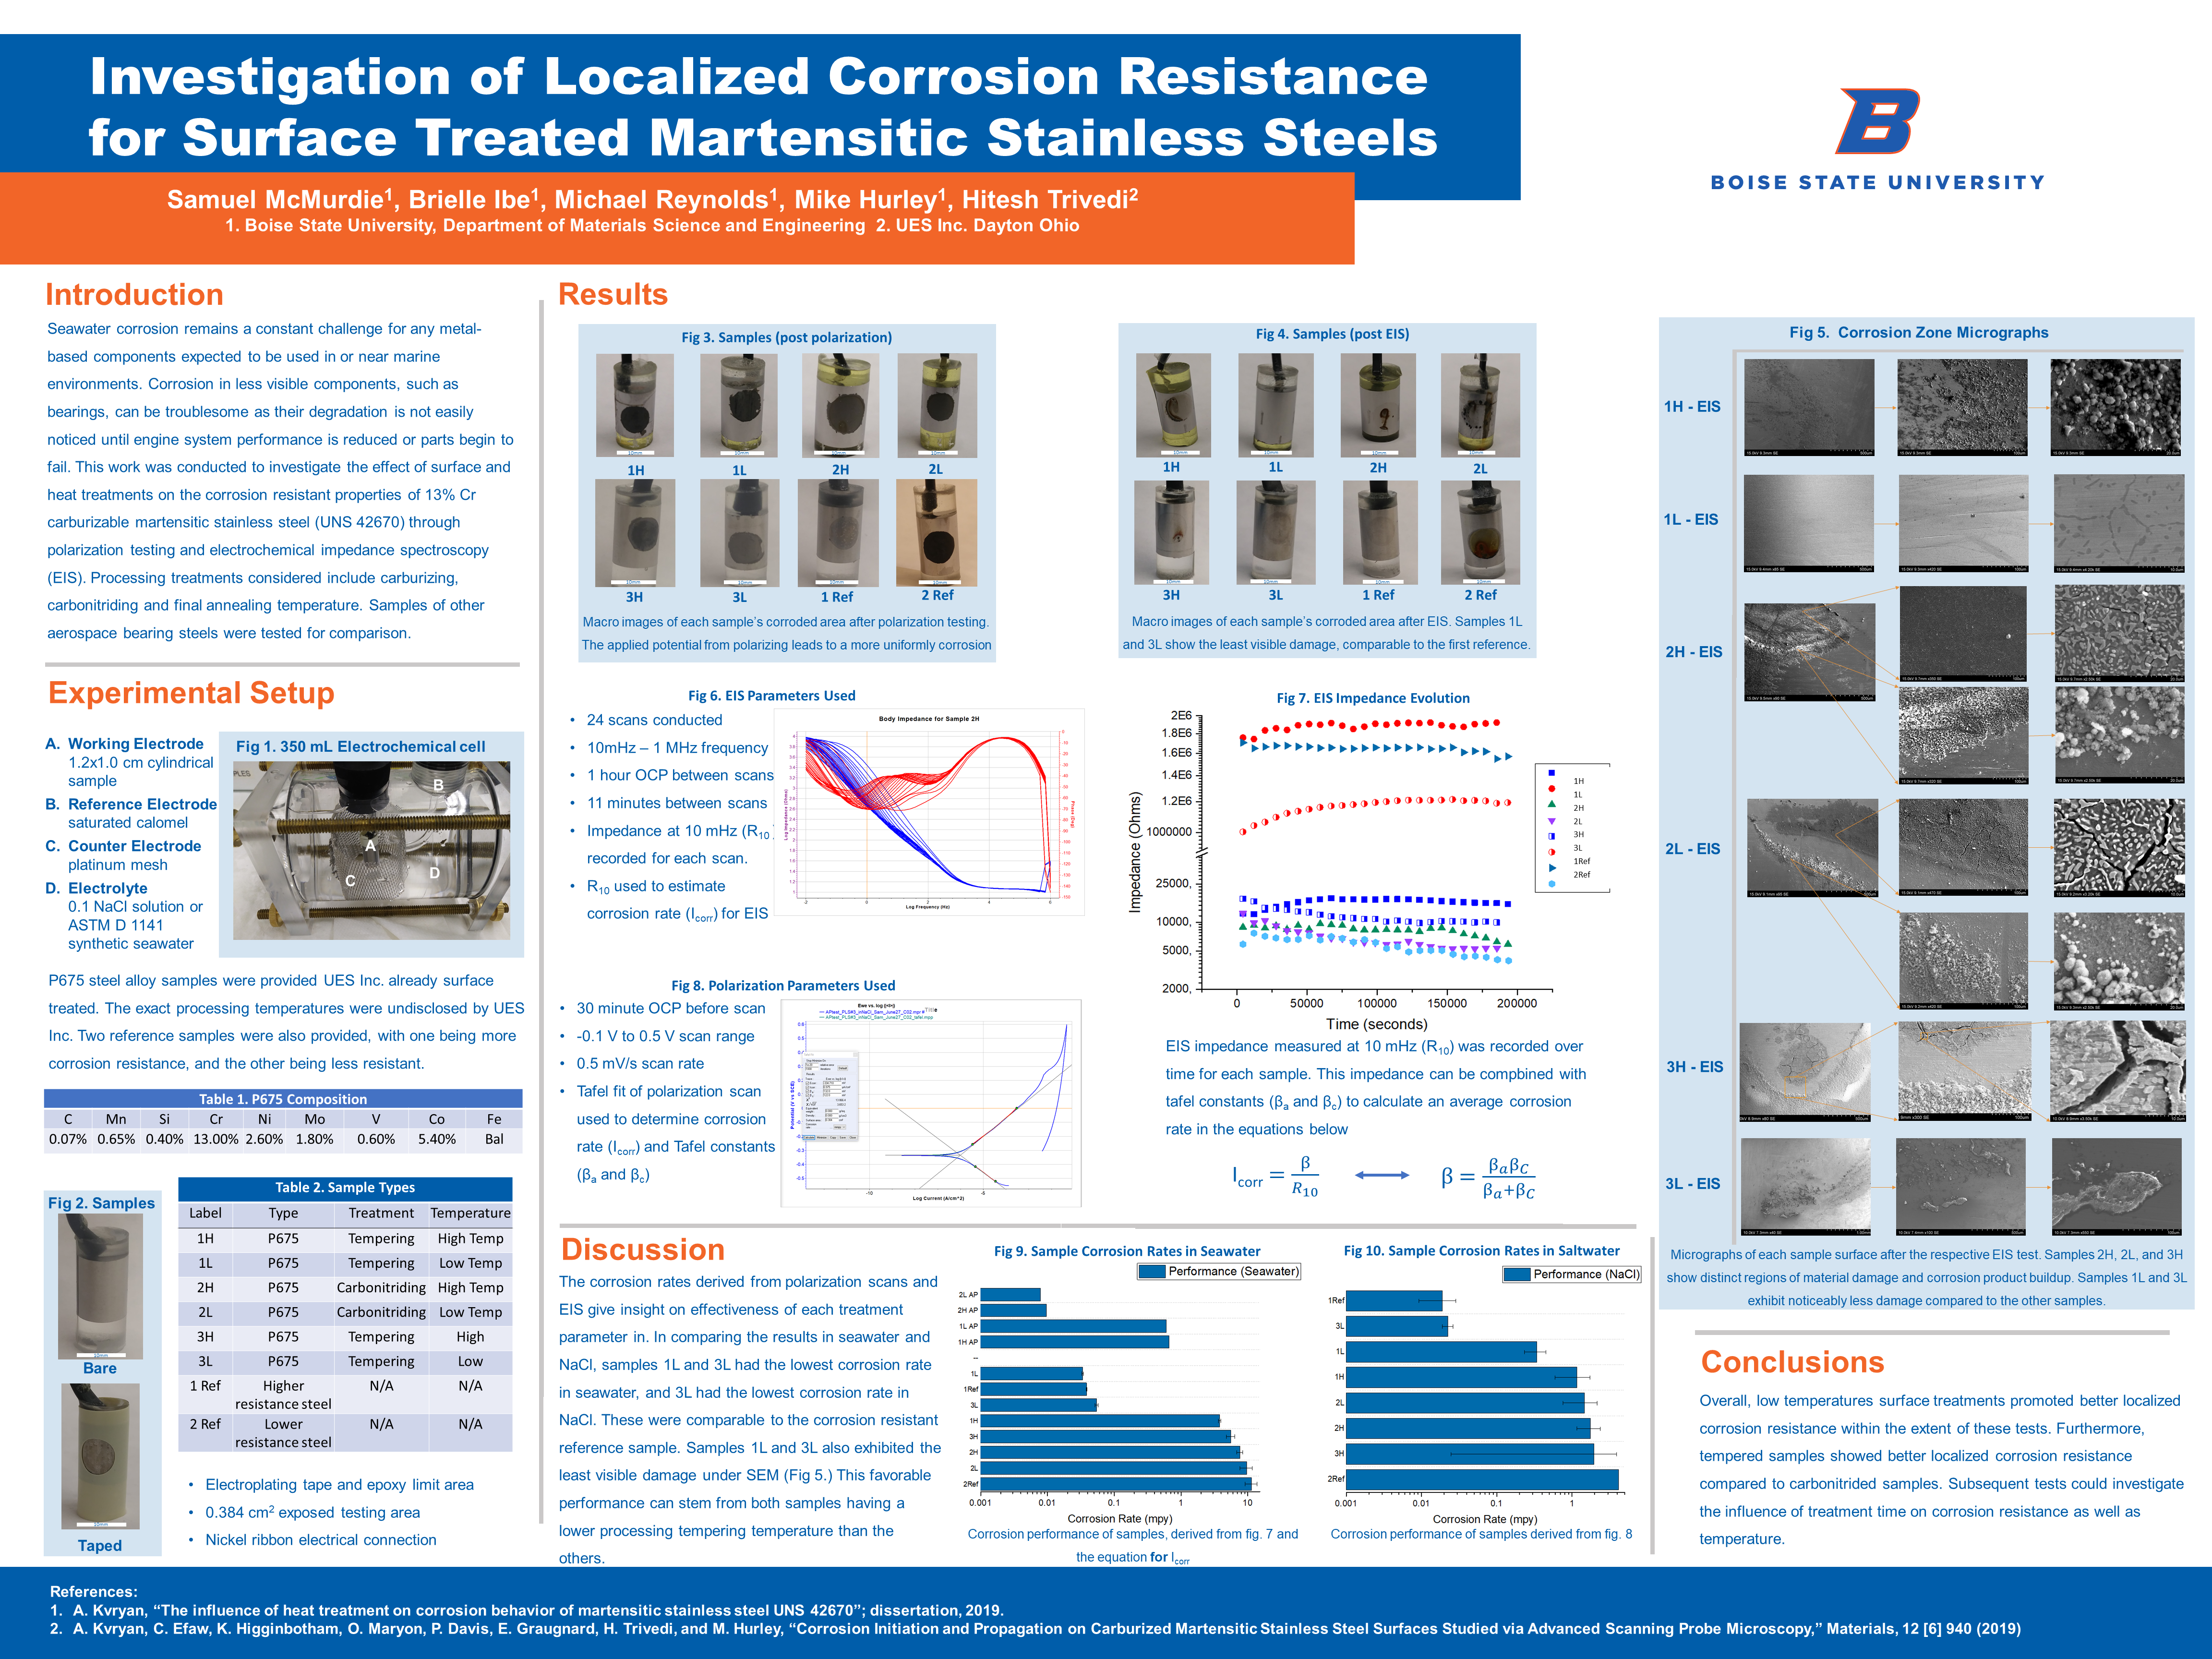
B. Reference Electrode saturated calomel C. Counter Electrode platinum mesh D. Electrolyte 0.1 NaCl solution or ASTM D 1141 synthetic seawater
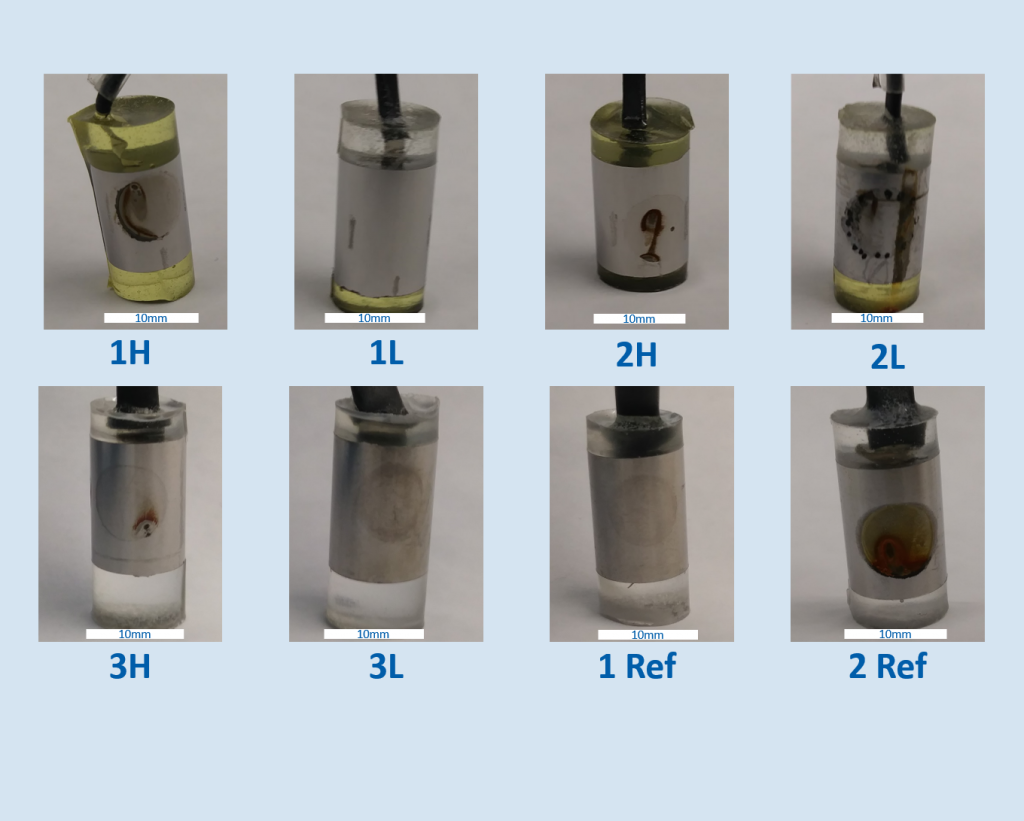
P675 steel alloy samples were provided UES Inc. already surface treated. The exact processing temperatures were undisclosed by UES Inc. Two reference samples were also provided, with one being more corrosion resistance, and the other being less resistant.
Table 1. P675 Composition
| C | Mn | Si | Cr | Ni | Mo | V | Co | Fe |
|---|---|---|---|---|---|---|---|---|
| 0.07% | 0.65% | 0.40% | 13.00% | 2.60% | 1.80% | 0.60% | 5.40% | Bal |
Table 2. Sample Types
| Label | Type | Treatment | Temperature |
|---|---|---|---|
| 1H | P675 | Tempering | High Temp |
| 1L | P675 | Tempering | Low Temp |
| 2H | P675 | Carbonitriding | High Temp |
| 2L | P675 | Carbonitriding | Low Temp |
| 3H | P675 | Tempering | High |
| 3L | P675 | Tempering | Low |
| 1 Ref | Higher resistance steel | N/A | N/A |
| 2 Ref | Lower resistance steel | N/A | N/A |
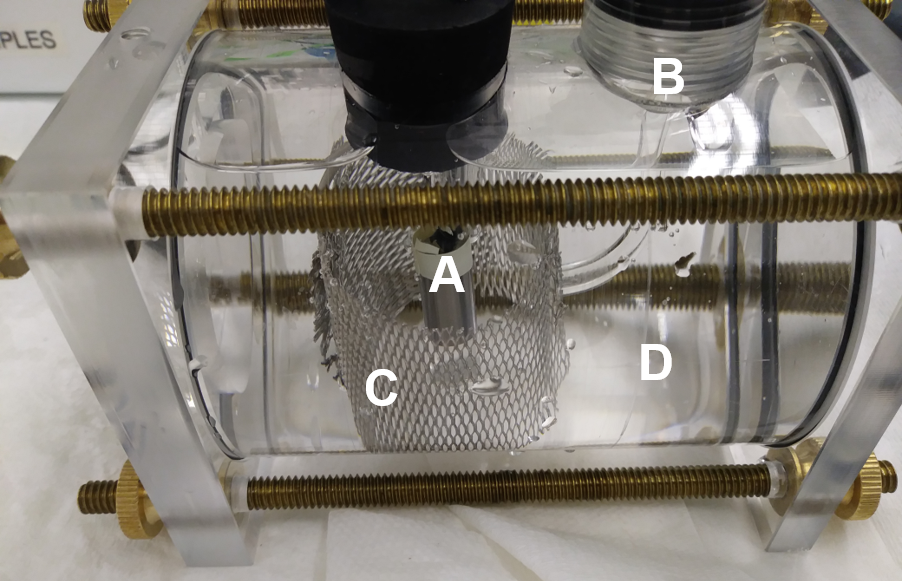
- Electroplating tape and epoxy limit area
- 0.384 cm2 exposed testing area
- Nickel ribbon electrical connection
Results
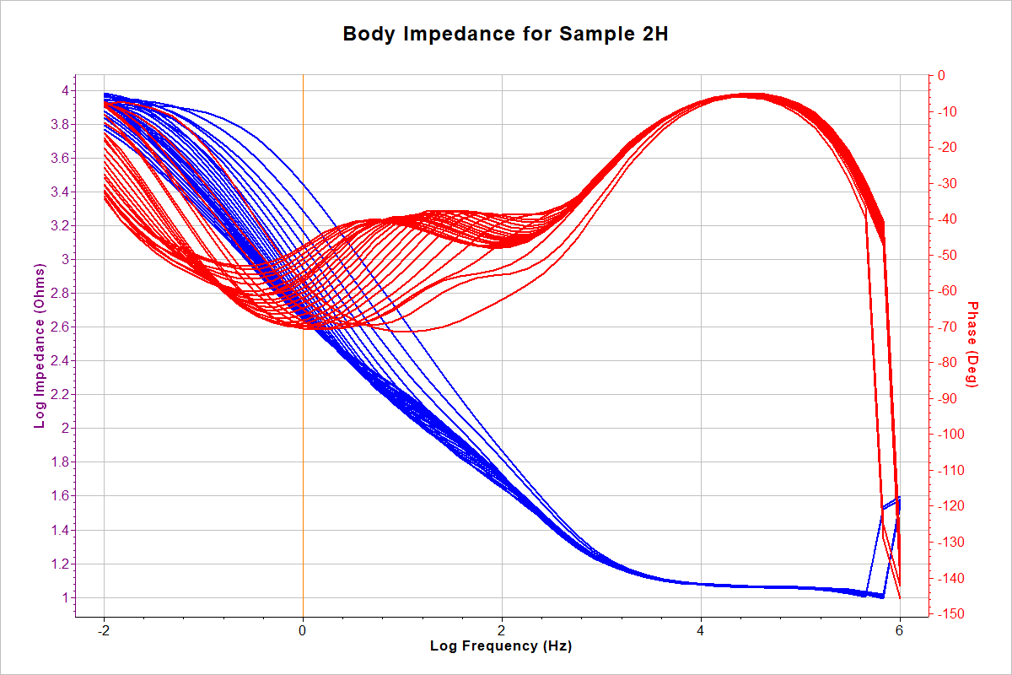
- 24 scans conducted
- 10mHz – 1 MHz frequency
- 1 hour OCP between scans
- 11 minutes between scans
- Impedance at 10 mHz (R10 ) recorded for each scan.
- R10 used to estimate corrosion rate (Icorr) for EIS
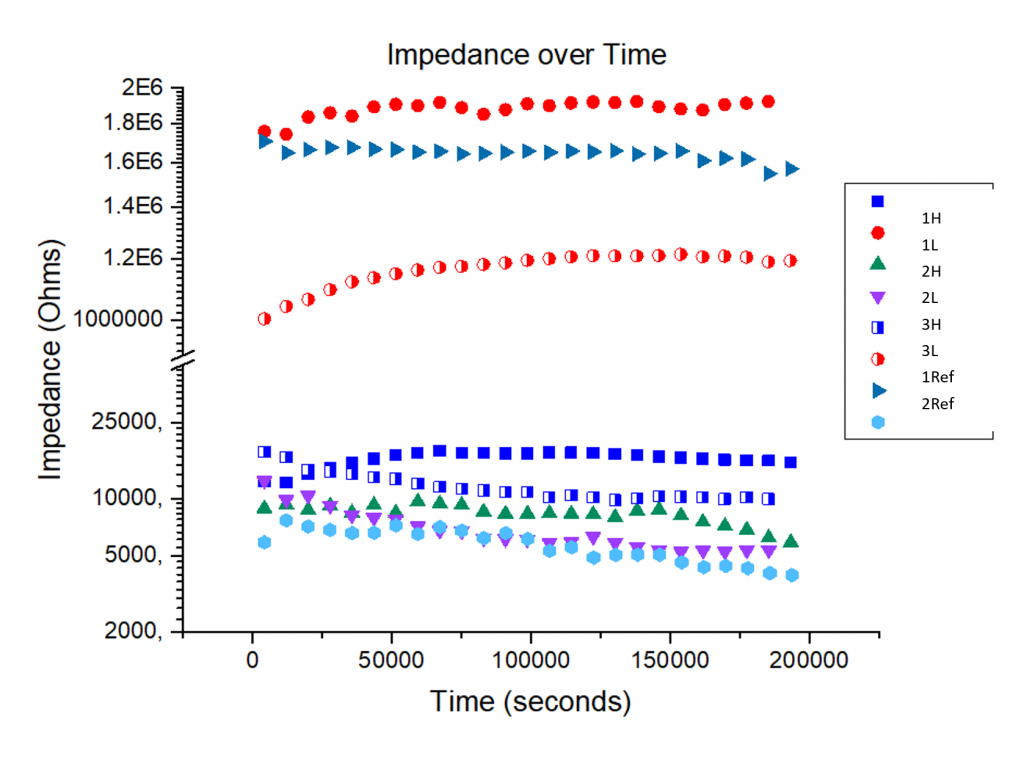
EIS impedance measured at 10 mHz (R10) was recorded over time for each sample. This impedance can be compbined with tafel constants (βa and βc) to calculate an average corrosion rate in the equations below

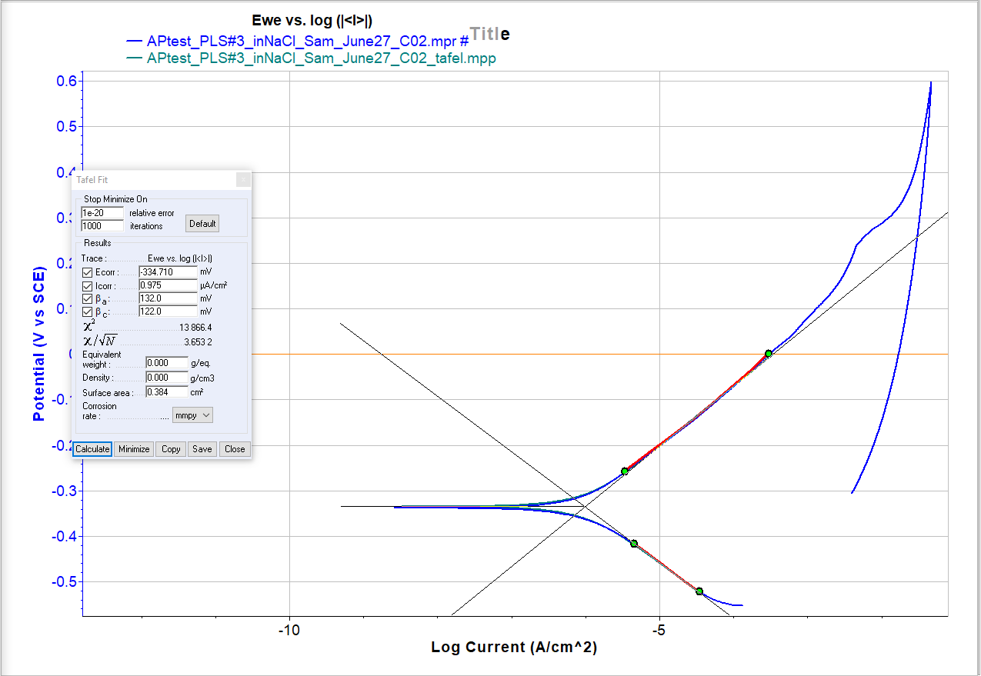
- 30 minute OCP before scan
- -0.1 V to 0.5 V scan range
- 0.5 mV/s scan rate
- Tafel fit of polarization scan used to determine corrosion rate (Icorr) and Tafel constants (βa and βc)
Discussion
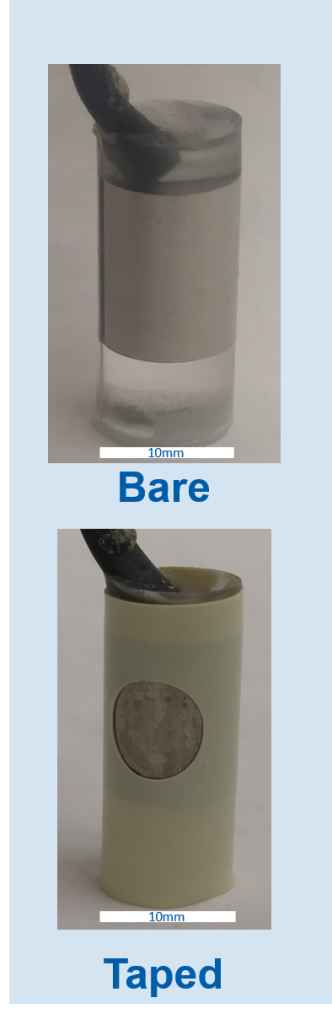
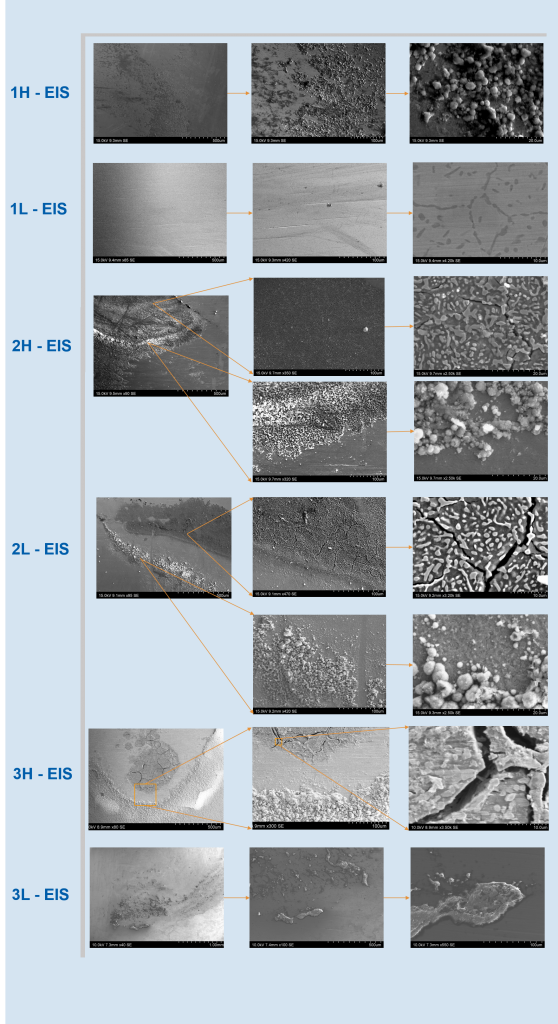
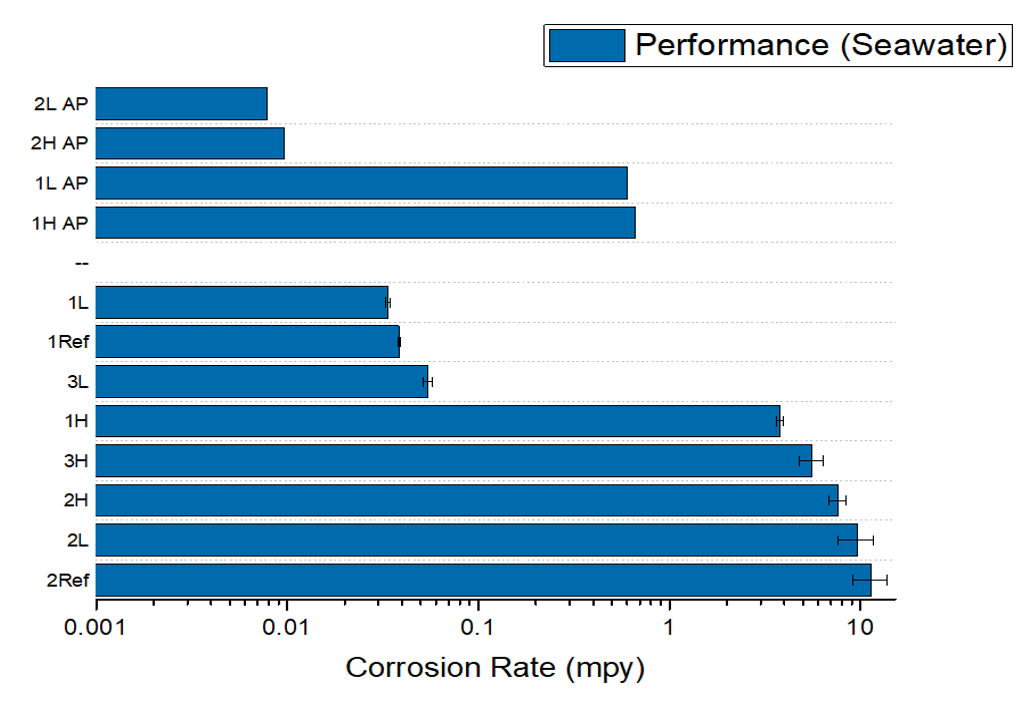
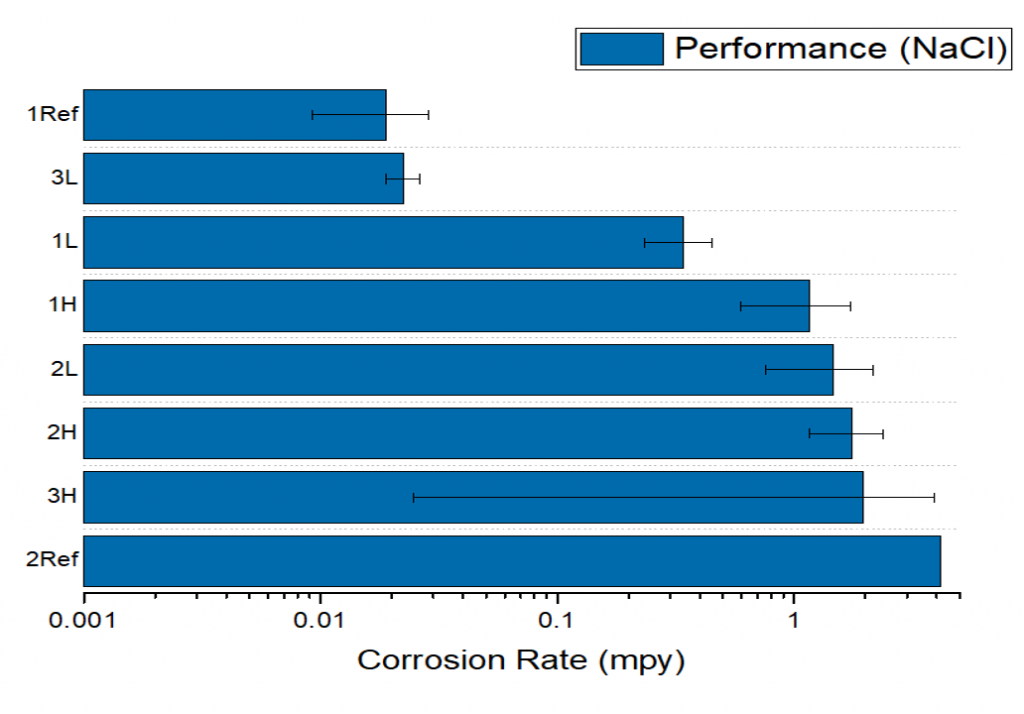
The corrosion rates derived from polarization scans and EIS give insight on effectiveness of each treatment parameter in. In comparing the results in seawater and NaCl, samples 1L and 3L had the lowest corrosion rate in seawater, and 3L had the lowest corrosion rate in NaCl. These were comparable to the corrosion resistant reference sample. Samples 1L and 3L also exhibited the least visible damage under SEM (Fig 5.) This favorable performance can stem from both samples having a lower processing tempering temperature than the others.
Conclusions
Overall, low temperatures surface treatments promoted better localized corrosion resistance within the extent of these tests. Furthermore, tempered samples showed better localized corrosion resistance compared to carbonitrided samples. Subsequent tests could investigate the influence of treatment time on corrosion resistance as well as temperature.
References
- A. Kvryan, “The influence of heat treatment on corrosion behavior of martensitic stainless steel UNS 42670”; dissertation, 2019.
- A. Kvryan, C. Efaw, K. Higginbotham, O. Maryon, P. Davis, E. Graugnard, H. Trivedi, and M. Hurley, “Corrosion Initiation and Propagation on Carburized Martensitic Stainless Steel Surfaces Studied via Advanced Scanning Probe Microscopy,” Materials, 12 [6] 940 (2019)
Additional Information
For questions or comments about this research, contact Samuel McMurdie at SamuelMcMurdie@u.boisestate.edu.