Development of Active Learning Lesson Plans to Supplement Existing Climate Curriculum
Alison Phillips, Dr. Jennifer Pierce
Introduction
The purpose of this project is to address the deficit of climate education in Boise Schools. The problem resides in science educational standards for the State of Idaho. While many parents and teachers want climate content to be taught, this is not enforced in Idaho’s state standards.
Methods
The focus of the lesson plan is active learning. This project focuses on one lesson plan that teaches the carbon cycle to students with two interactive activities. One is an indoor classroom –similar to an activity by Kerrie Weppner designed for college students – and the second is an outdoor tag game. These activities provide the structure to foster a positive individual and group learning experience.
Lesson Description
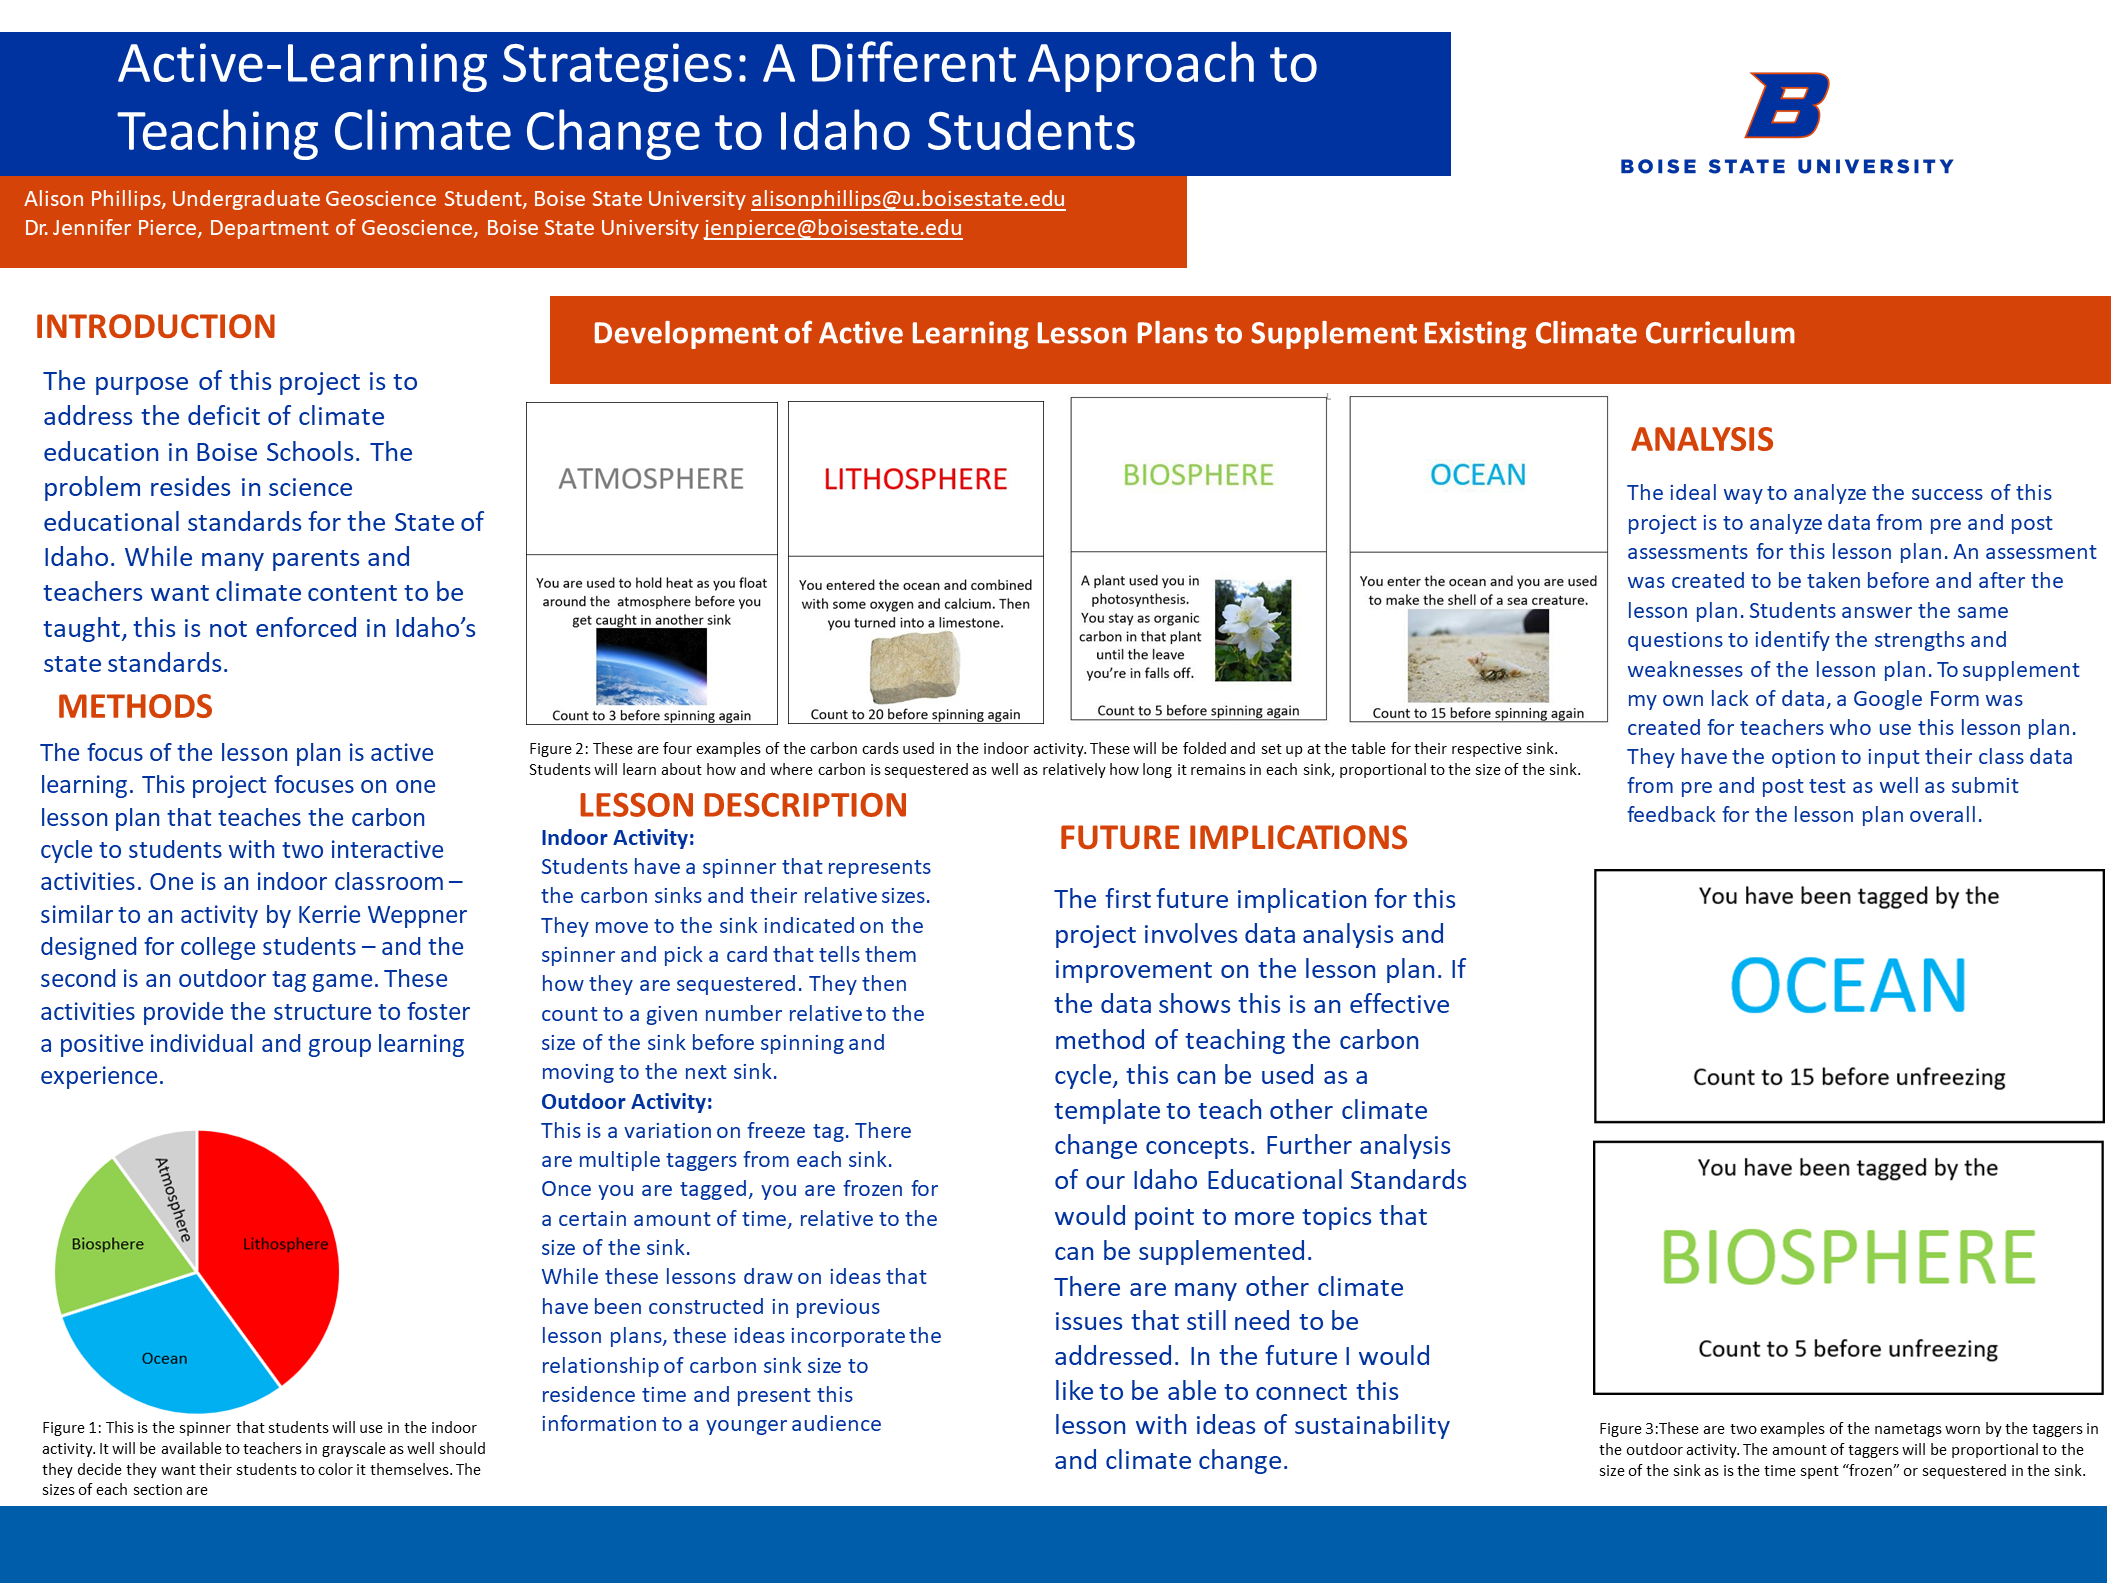
Indoor Activity:
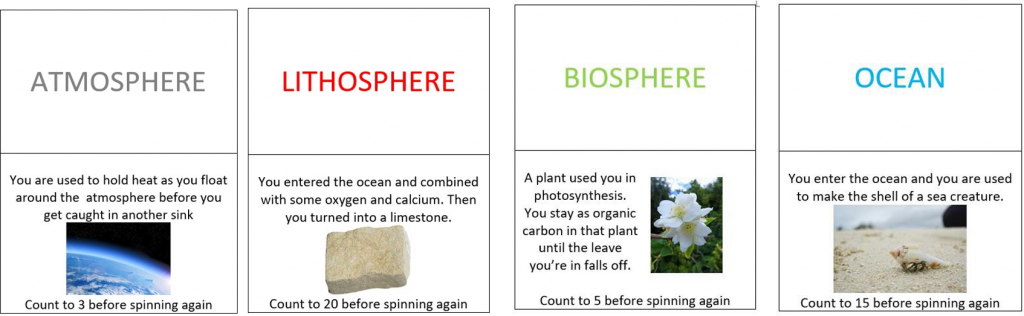
Students have a spinner that represents the carbon sinks and their relative sizes. They move to the sink indicated on the spinner and pick a card that tells them how they are sequestered. They then count to a given number relative to the size of the sink before spinning and moving to the next sink.
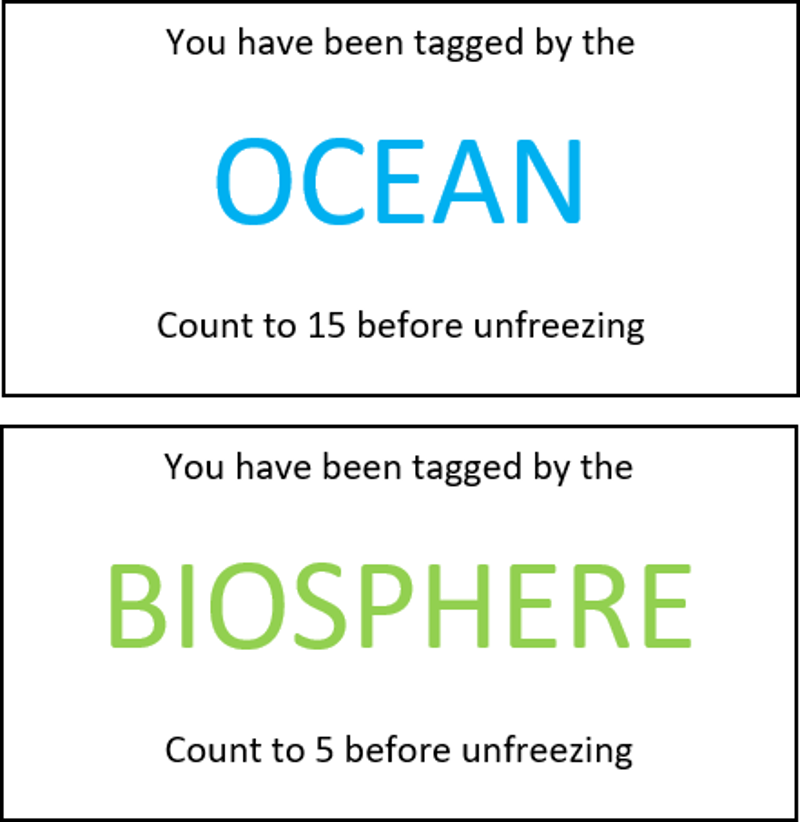
Outdoor Activity:
This is a variation on freeze tag. There are multiple taggers from each sink. Once you are tagged, you are frozen for a certain amount of time, relative to the size of the sink.
While these lessons draw on ideas that have been constructed in previous lesson plans, these ideas incorporate the relationship of carbon sink size to residence time and present this information to a younger audience.
Future Implications
The first future implication for this project involves data analysis and improvement on the lesson plan. If the data shows this is an effective method of teaching the carbon cycle, this can be used as a template to teach other climate change concepts. Further analysis of our Idaho Educational Standards would point to more topics that can be supplemented.
There are many other climate issues that still need to be addressed. In the future I would like to be able to connect this lesson with ideas of sustainability and climate change.
Analysis
The ideal way to analyze the success of this project is to analyze data from pre and post assessments for this lesson plan. An assessment was created to be taken before and after the lesson plan. Students answer the same questions to identify the strengths and weaknesses of the lesson plan. To supplement my own lack of data, a Google Form was created for teachers who use this lesson plan. They have the option to input their class data from pre and post test as well as submit feedback for the lesson plan overall.
Additional Information
For questions or comments about this research, contact Alison Phillips at alisonphillips@u.boisestate.edu.