Hannah Spero, Dr. Donna Calhoun, Dr. Brittany Brand, Dr. Jeffrey B. Johnson
Abstract
Worldwide there are large threats from geohazards, especially from dam failures. In the United States a dam failure could result in a million and a half people losing their lives and becoming homeless. Over 20% of the dams within the United States have high hazard potential. On June 5th, 1976, the Teton Dam of Newdale, Idaho failed, devastating downstream communities, causing 2.9 billion dollars of damage, and costing the lives of five people. We are creating numerical modeling to better understand the downstream consequences of dam failure. This work is combining field observations of drone photogrammetry and 2-D numerical flood simulation modeling through GeoClaw to characterize the earthen dam failure of the Teton Dam. GeoClaw is a software that solves the nonlinear shallow wave equations with an evolving wet and dry flow front. Additionally, the field methods are drone photogrammetry, specifically Structure for Motion (SfM) with point clouds and improved DEMs for resolution bank and floodplain topography. The preliminary results of the modeling thus far show good agreement between simulation gauge points and the downstream consequences taken from historical literature. A variable Manning’s roughness coefficient ranging in magnitude from 0.5 to 1.0 was implemented in the simulated hydraulics. These findings validate the GeoClaw software for overland flooding. With this software calibrated, future dam modeling can be conducted to create flood maps for local communities, to communicate threats to lawmakers in a visually impactful way, and to aid in the design and location of future dams.
Introduction
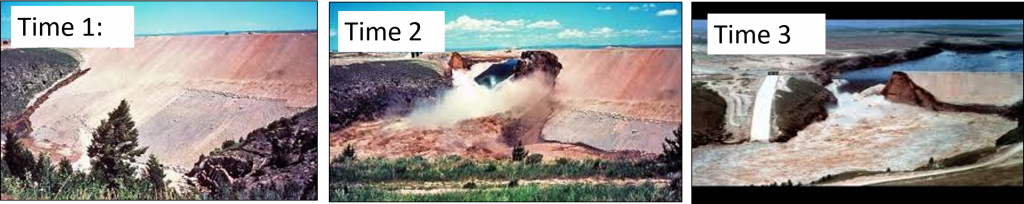
Around the world, there is a potential of dam failure resulting in loss of life and damage. In the U.S., there is a continuing decline of dam infrastructure. The ASCE gives dam infrastructure in in the US a grade D.
Research Problem
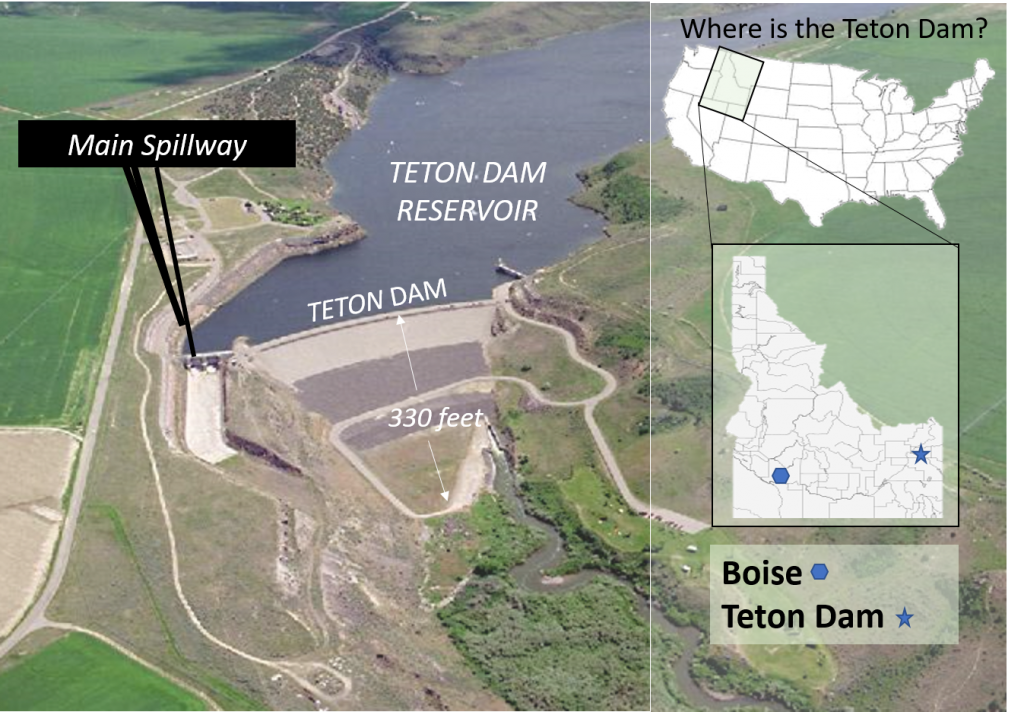
We are modeling the downstream consequences of the historic Teton Dam failure. Our goals are to calibrate the open-source software package GeoClaw for flooding scenarios using historical data available in literature.
Methods: GeoClaw (Phase 1)
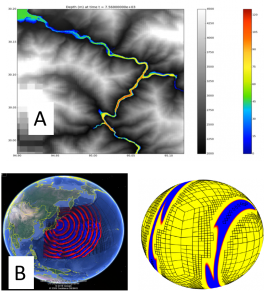
- “GeoClaw is based on the finite volume wave propagation algorithm in Clawpack” (R. J. LeVeque, D. George, M. Berger, K. Mandli)
- Use finite volume scheme with suitable Riemann solver that can handle wet/dry states and embeds the evolving flood into background mesh
- Numerical gauges allow for easy comparison with observational data
- GeoClaw was used recently used to model an outburst dam (Reference A)
- “GeoClaw has been widely used for modeling tsunamis, storm surges, and debris flows” (Reference B).
- Massively parallel version available in ForestClaw (www.forestclaw.org), (Reference C)
Phase 1 GeoClaw
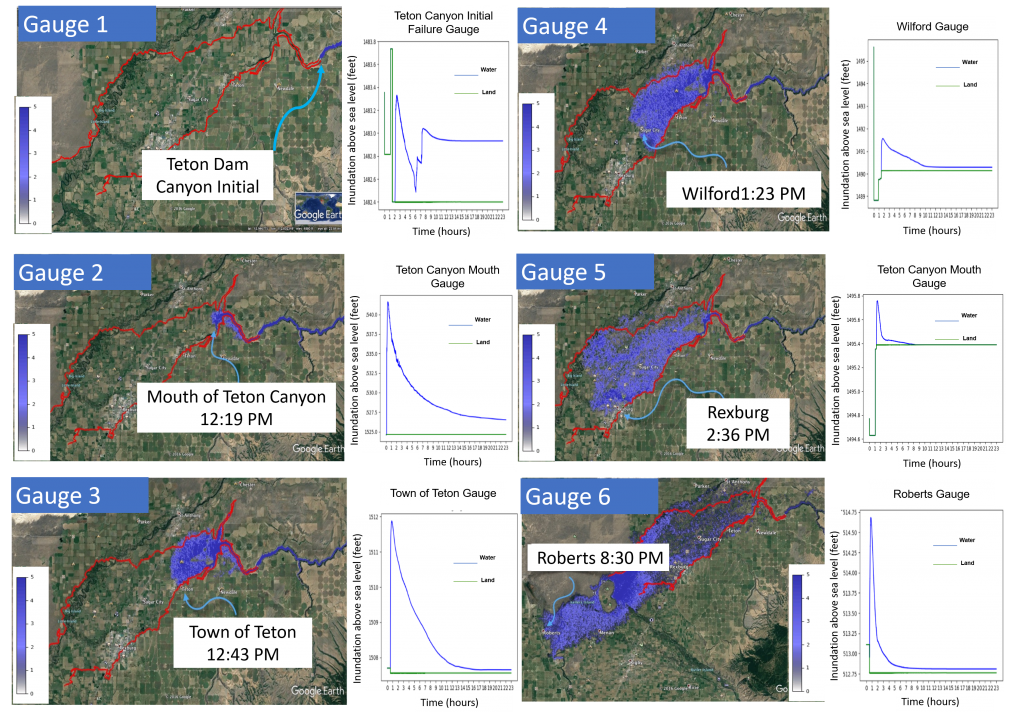
Preliminary Results and Conclusions
The six gauges in the section above reflect the most recent run of the Teton Dam simulation of GeoClaw ran on R2 supercomputer.
- Duration of simulation = 23 hours and Computing time = 1 hour on R2*
- (GeoClaw code adapted to Teton Dam failure using 3D Navier-Stokes equation, Boussinesq, and 2D SWE continuity equation.
- Size of the physical domain (80 km^2); Adaptive Mesh Refinement (AMR) Resolution at the finest level is about 10 meters
- Use OpenMP to run GeoClaw in multi=core environment on R2.
- Future plans include running GeoClaw extension of ForestClaw in a distributed environment using MPI.
*R2 is a BSU supercomputer (compute cluster) used for parallel computing over many CPU’s at once.
Phase 2: Geophysical Fieldwork Fall 2020
Structure for Motion (SfM) Drone Photogrammetry
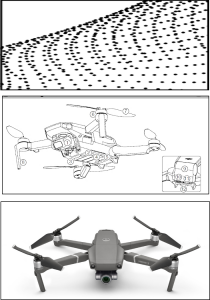
- Characterize the Teton Dam failure
- Produce outreach animation modeling
- Collect ground reconnaissance data to generate a Digital Surface Model (DSM)
Goals with using SfM:
- Improve resolution and modeling of dam failure
- Institute a variable Manning’s n into the simulation
- Add additional gauges into simulation to further improve accuracy of simulation
- Integrate high resolution topography in GeoClaw
- Refine the reservoir boundaries using Bureau of Reclamation datasets
Acknowledgements
Thanks to Dr. Brittany Brand of the Hazards and Climate Resiliency Institute (HCRI), to the Bureau of Reclamation for their outreach and collaboration, and to Dr. David Wilkins for his input on the geomorphology and geology.
References
Reference B: M. J. Berger, D. L. George, R. J. LeVeque, and K. T. Mandli, The GeoClaw software for depth-averaged flows with adaptive refinement, Adv. Water Resour., 34 (2011), pp. 1195–1206.
- Reference A: Michael D. Turzewski, Katharine W. Huntington, Alexis Licht and Karl A. Lang, Provenance and erosional impact of Quaternary megafloods through the Yarlung-Tsangpo Gorge from zircon U-
- Pb geochronology of flood deposits, eastern Himalaya, Earth and Planetary Science Letters, 10.1016/j.epsl.2020.116113, 535, (116113), (2020).
- Reference C: http://www.forestclaw.org
- https://www.infrastructurereportcard.org/cat-item/dams/
- https://www.preventionweb.net/news/view/65208
- http://www.clawpack.org
- http://www.geoclaw.org
- A neural model of how the brain computes heading from optic flow in realistic scenes
- Some results in the gauge section were ran with the assistance of Dr. Donna Calhoun, for reference.
Additional Information
For questions or comments about this research, contact Hannah Spero at hannahspero@u.boisestate.edu