Gabby Halaby & Dr. Gena Nelson
Introduction
Students need to have a proficient understanding of foundational mathematics concepts to master more advanced skills as schooling becomes more complex at the middle school, high school, and college level. Archer and Hughes (2011) established connections between high academic achievement and explicit instruction. Research conducted in special education for students with learning disabilities suggests that explicit instruction that provides students with opportunities to engage with critical content, incorporates active teacher monitoring, and fosters positive learning environments increases students’ progress towards academic goals.
Method
This study involved two students in the Boise School District who were receiving special education services in mathematics. The students should have received 4 weeks of interventions in math computation, word problems, and order of operations but because of COVID-19, students only received 1 week of intervention. The intervention was delivered for 30 minutes, twice a week. Before, during, and after the intervention, the participants were given a fifth-grade progress monitoring test to measure the effect of the intervention. This poster will report on the results of our study and discuss the impact that explicit instruction has on students with learning disabilities. Additionally, the poster will demonstrate how two students may receive a similar score on a test but actually have different learning needs from one another.
Student Performance in Each Type of Problem
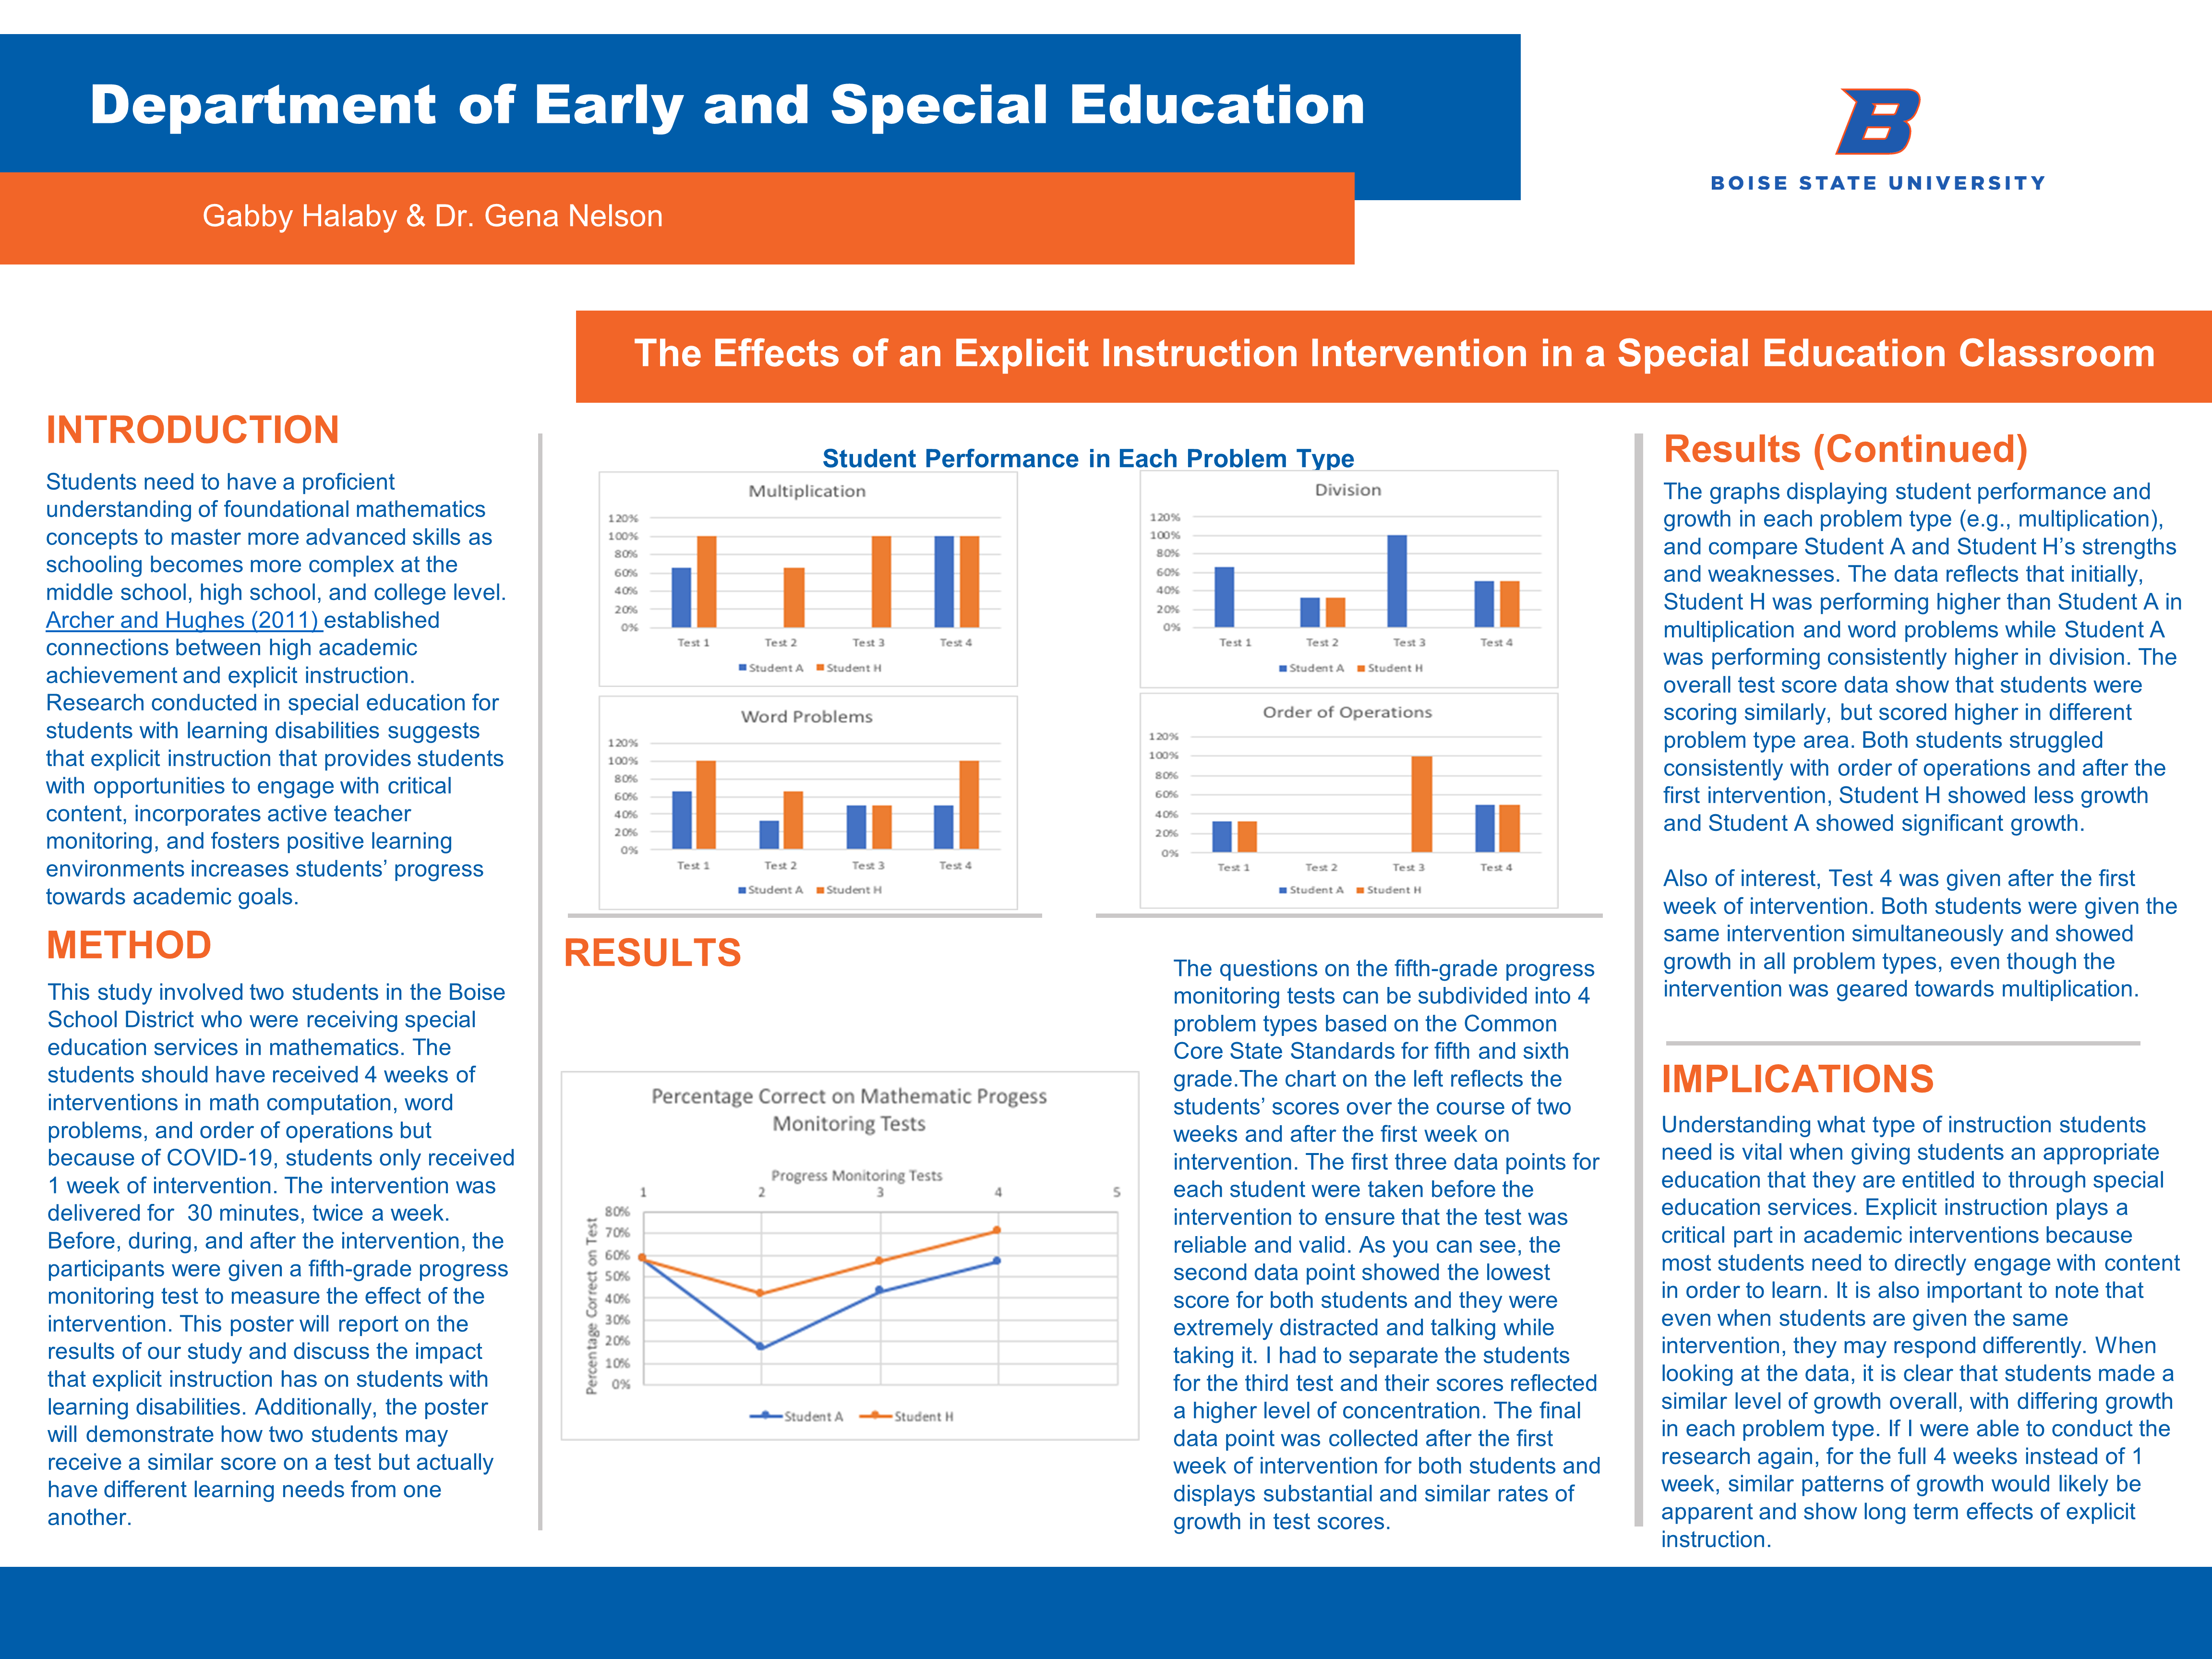
Multiplication
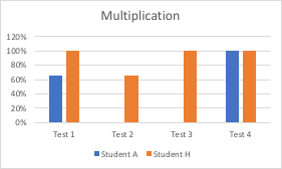
Word Problems
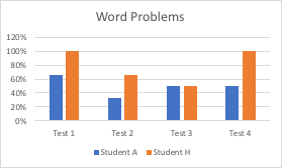
Division
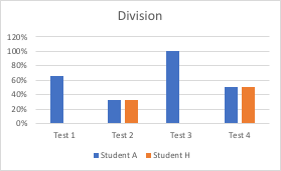
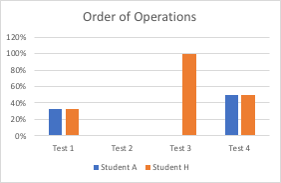
Order of Operations
Results
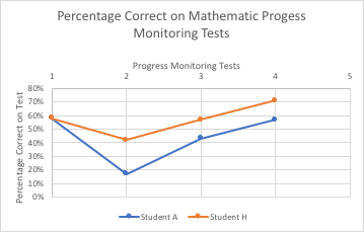
The questions on the fifth-grade progress monitoring tests can be subdivided into 4 problem types based on the Common Core State Standards for fifth and sixth grade. The chart below the students’ scores over the course of two weeks and after the first week on intervention. The first three data points for each student were taken before the intervention to ensure that the test was reliable and valid. As you can see, the second data point showed the lowest score for both students and they were extremely distracted and talking while taking it. I had to separate the students for the third test and their scores reflected a higher level of concentration. The final data point was collected after the first week of intervention for both students and displays substantial and similar rates of growth in test scores.
The graphs displaying student performance and growth in each problem type (e.g., multiplication), and compare Student A and Student H’s strengths and weaknesses. The data reflects that initially, Student H was performing higher than Student A in multiplication and word problems while Student A was performing consistently higher in division. The overall test score data show that students were scoring similarly, but scored higher in different problem type area. Both students struggled consistently with order of operations and after the first intervention, Student H showed less growth and Student A showed significant growth.
Also of interest, Test 4 was given after the first week of intervention. Both students were given the same intervention simultaneously and showed growth in all problem types, even though the intervention was geared towards multiplication.
Implications
Understanding what type of instruction students need is vital when giving students an appropriate education that they are entitled to through special education services. Explicit instruction plays a critical part in academic interventions because most students need to directly engage with content in order to learn. It is also important to note that even when students are given the same intervention, they may respond differently. When looking at the data, it is clear that students made a similar level of growth overall, with differing growth in each problem type. If I were able to conduct the research again, for the full 4 weeks instead of 1 week, similar patterns of growth would likely be apparent and show long term effects of explicit instruction.
Additional Information
For questions or comments about this research, contact Gabby Halaby at gabbyhalaby@u.boisestate.edu.