Reevaluation of the Pressure and Temperature History of Metamorphic Rocks in the Eastern Alps
Kyra Schroeder, Maya Cizina, Sam Couch, Dr. Matthew Kohn
Abstract
Metamorphic rocks form and evolve in response to changes in Pressure (P) and Temperature (T). Application of thermodynamics to mineral compositions is commonly used to calculate P-T histories of metamorphic rocks. Geologists use this information to interpret Earth’s processes. Here, we test the accuracy of the P-T paths for the eastern Alps constructed 35 years ago (Selverstone et al., 1984, Journal of Petrology, v25, 501-531) using improved thermodynamic calculations.
We first used optical petrography to identify of minerals, textures, and metamorphic facies. We then used Boise State’s Electron Probe Microanalyzer, with back-scattered electron imaging to verify mineral identifications and guided where to collect chemical analyses. Lastly, we used thermodynamic calculation software applied to these chemical data to constrain bounds on P-T conditions. Whereas Selverstone et al. (1984) report P-T conditions of 7±1 kilobars (25 km depth) and 550±25 degrees °C, our calculations show an indistinguishable pressure of 7±1 kilobars, but a higher temperature of 635±25°C. The higher temperature implies that tectonic plates were warmer than once inferred. Because rocks become less brittle with increasing temperature, brittle phenomena such as earthquakes in the past would have occurred at shallower depths.
Geologic Background
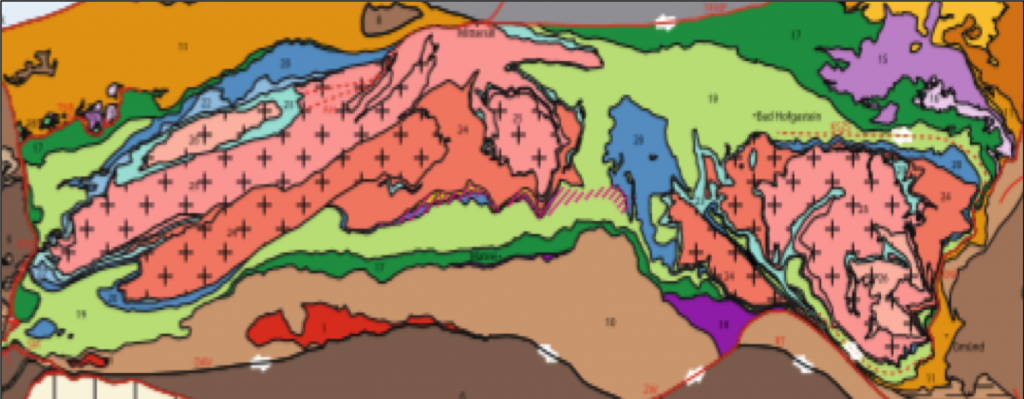
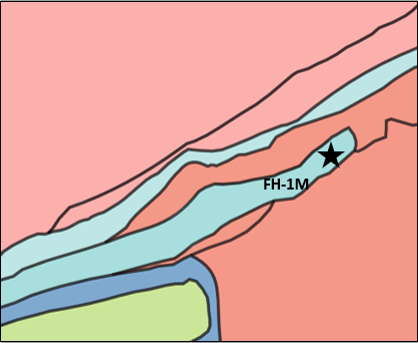
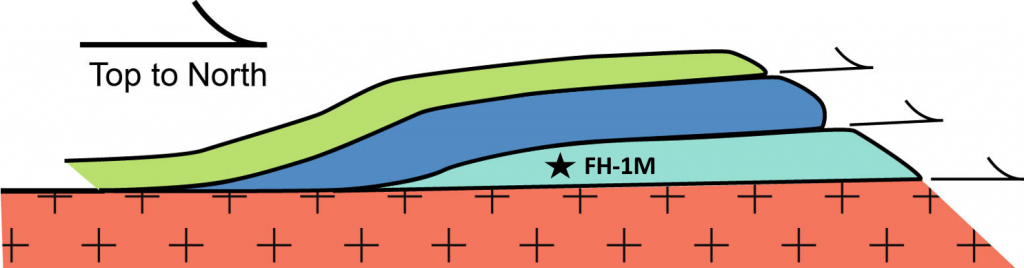
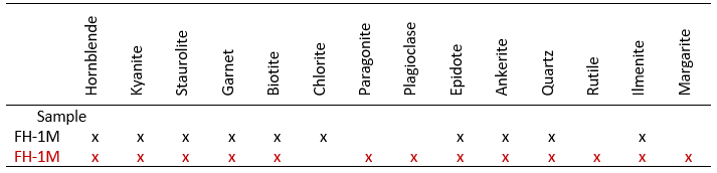
- Sample FH1M is exposed in the Tauern Window Series located in the Eastern Alps of western Austria (Figure 1 and 2).
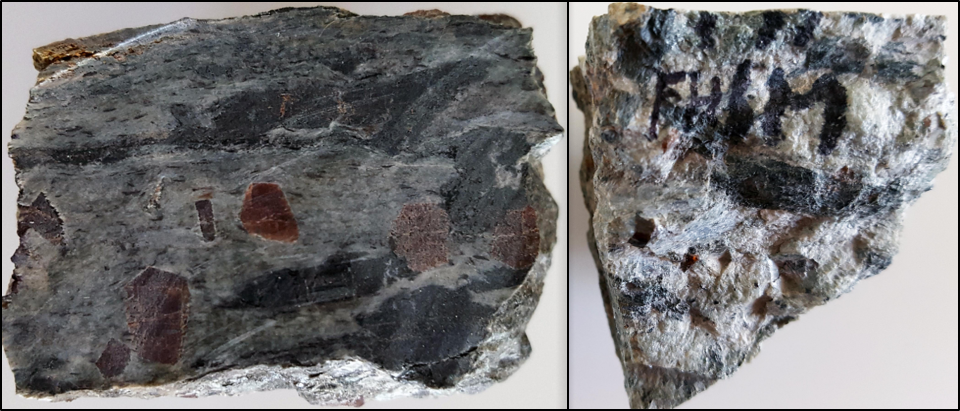
- This hornblende garbenschist unit was developed within Austroalpine thrust sheets (Figure 3).
- The maximum pressure and temperature previously determined for this region are 10.5 kbar (c. 35 km depth) and 550 °C (Selverstone et al. 1984).
Objectives
To complete an independent analysis of PT conditions for the Eastern Alps and to compare with Selverstone et al. (1984).
Methods
Mineral Identification:
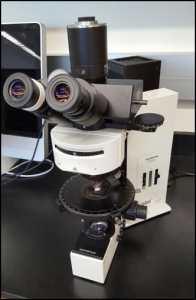
- Light microscopy using a petrographic microscope
- Back-scattered electron imaging using Electron Probe Microanalyzer (EPMA)
- Energy dispersive analysis using EPMA
Defined mineral compositions and zoning:
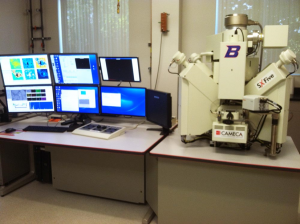
- X-ray mapped thin section (EPMA)
c. 1 μm spot analysis (EPMA
Data analysis:
Pressure-temperature conditions:
Geothermobarometry (GTB)
- Uses only well-calibrated thermometers and barometers
Thermocalc
- Solves for a best-fit P-T condition based on multiple equilibria
TWQ
- Calculates all possible thermometers and barometers
P-T growth history of chemically zoned garnets:
Gibbs
- Uses differential thermodynamics to calculate ΔP and ΔT
Key Results
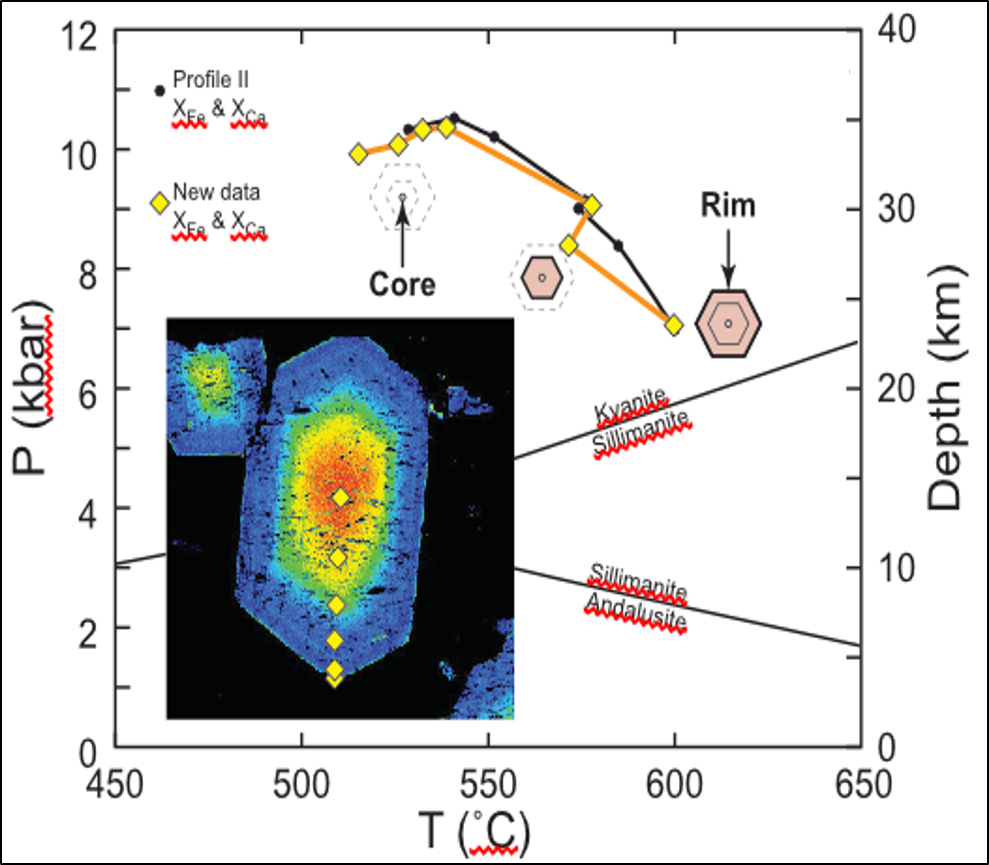
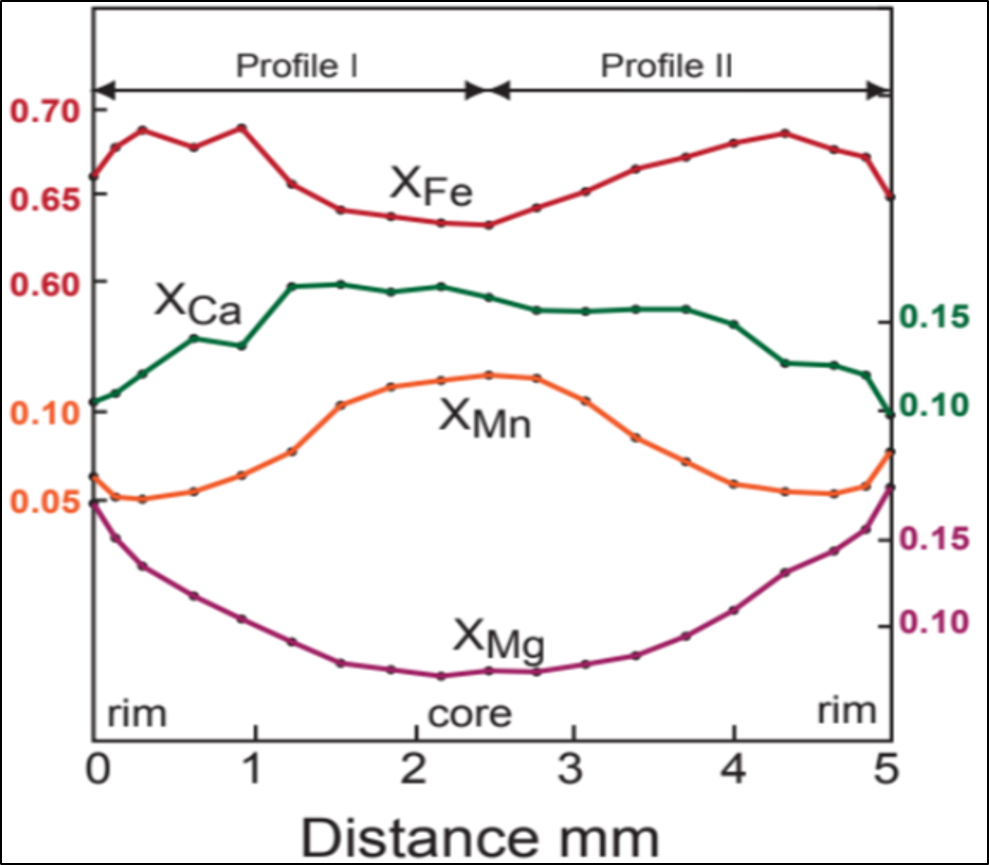
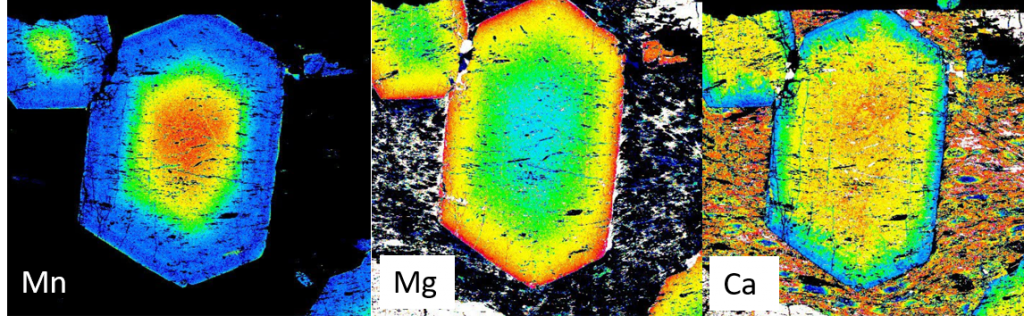
- Garnets preserve growth zoning in their chemistry (Figure 4 and 5).
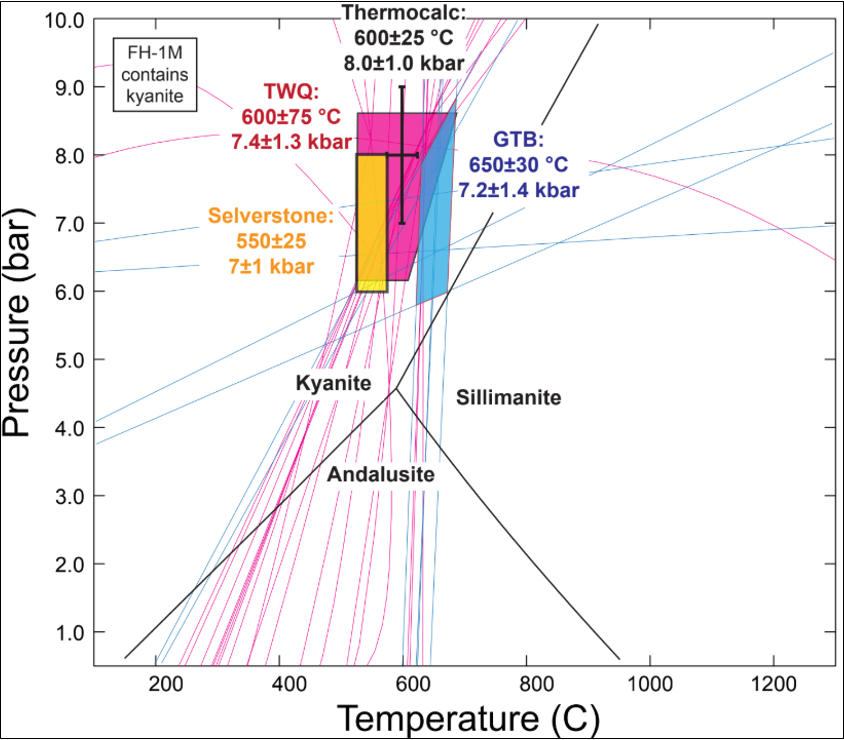
- Calculations of garnet rim pressure-temperature conditions are similar using different methods (Figure 3).
- GTB: 650±30 °C and 7.2±1.4 kbar
- Thermocalc: 600±25 °C and 8.0±1.0 kbar
- TWQ: 600±75 °C and 7.4±1.3 kbar
Conclusions
- Calculated peak temperatures(c. 600 °C) are higher than Selverstone et al.’s (550±25 °C) (Figure 3).
- Calculated peak pressures are Indistinguishable from Selverstone et al.’s estimates (within ±1 kbar) (Figure 3).
- Using new chemical measurements and models yields a similar P-T path as older data and models.
- Future analysis will determine P-T paths using a different thermodynamically based method (PerpleX).
- We will also use a physics-based method (rather than thermodynamics) to calculate maximum pressures at which garnet nucleated.
Implications
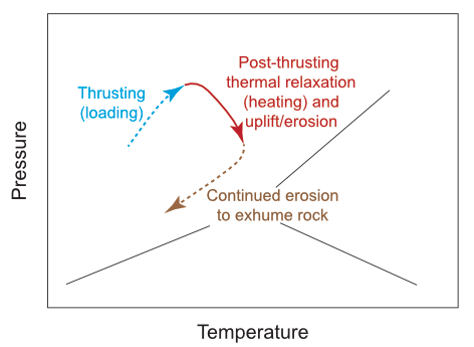
- The decrease in pressure recorded in the garnet zoning reflects uplift and erosion after thickening of the crust (Figure 6).
- The increase in temperature recorded in the garnet zoning reflects a response of the thermal structure of the crust after thickening (Figure 7).
Details
- Pressure and temperature data are consistent with Selverstone et al. (1984) which shows an increase in pressure followed by a decrease in pressure with a increasing temperature (Figure 4).
- In garnet, zoning of Magnesium (increasing toward the rim) and Manganese (decreasing toward the rim) is consistent with garnet growth, i.e., garnet preserves original growth zoning (Figure 5 and Figure 8).
- The fine structure in zoning suggests diffusion did not significantly homogenize garnet compositions.
References
- Schmid, S. M., Scharf, A., Handy, M. R., & Rosenberg, C. L. (2013). The Tauern Window (Eastern Alps, Austria): A new tectonic map, with cross-sections and a tectono-metamorphic synthesis. Swiss Journal of Geosciences, 106(1), 1-32. doi:10.1007/s00015-013-0123-y
- Selverstone, J., Spear, F. S., Franz, G., and Morteani, G. (1984). High-Pressure Metamorphism in the SW Tauern Window, Austria: P-T Paths from Hornblende-Kyanite-Staurolite Schists. Journal of Petrology, v25 501-531 doi: 10.1093/petrology/25.2.501
Additional Information
For questions or comments about this research, contact Kyra Schroeder at kyraschroeder@u.boisestate.edu.