Carter Strope, Heidi Ware Carlisle, Dr. Jay D. Carlisle, Bryce W. Robinson

Introduction
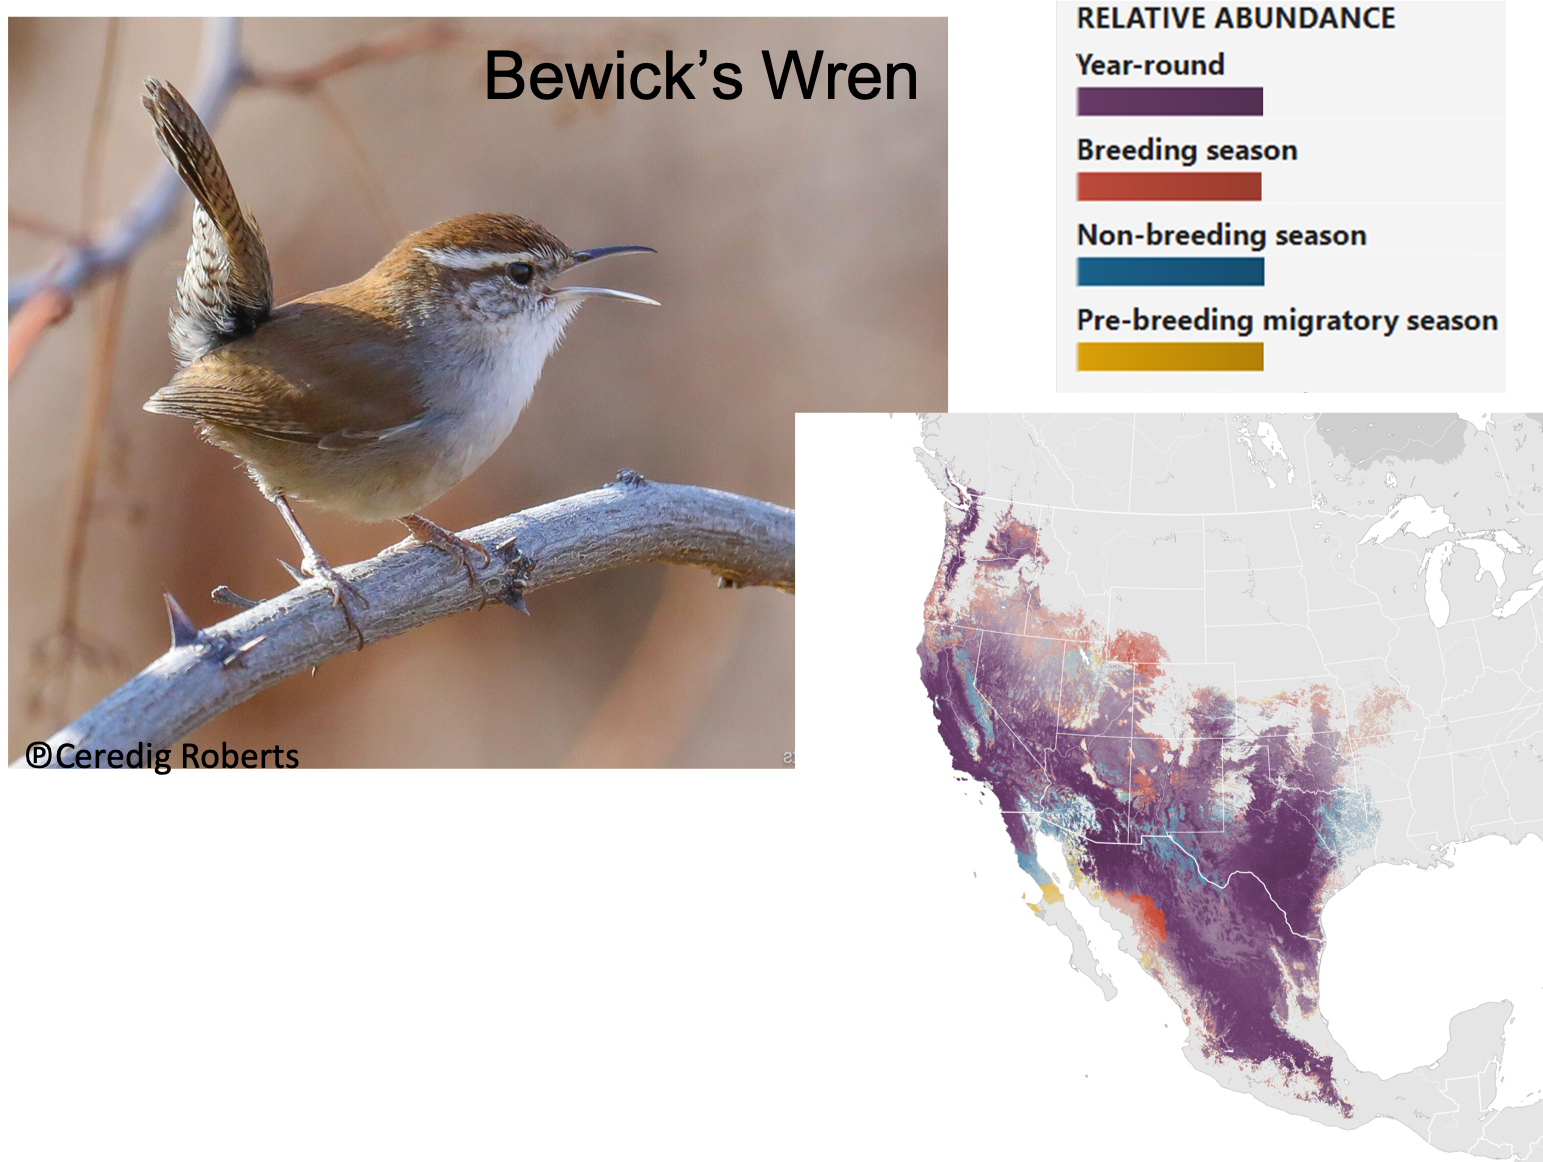
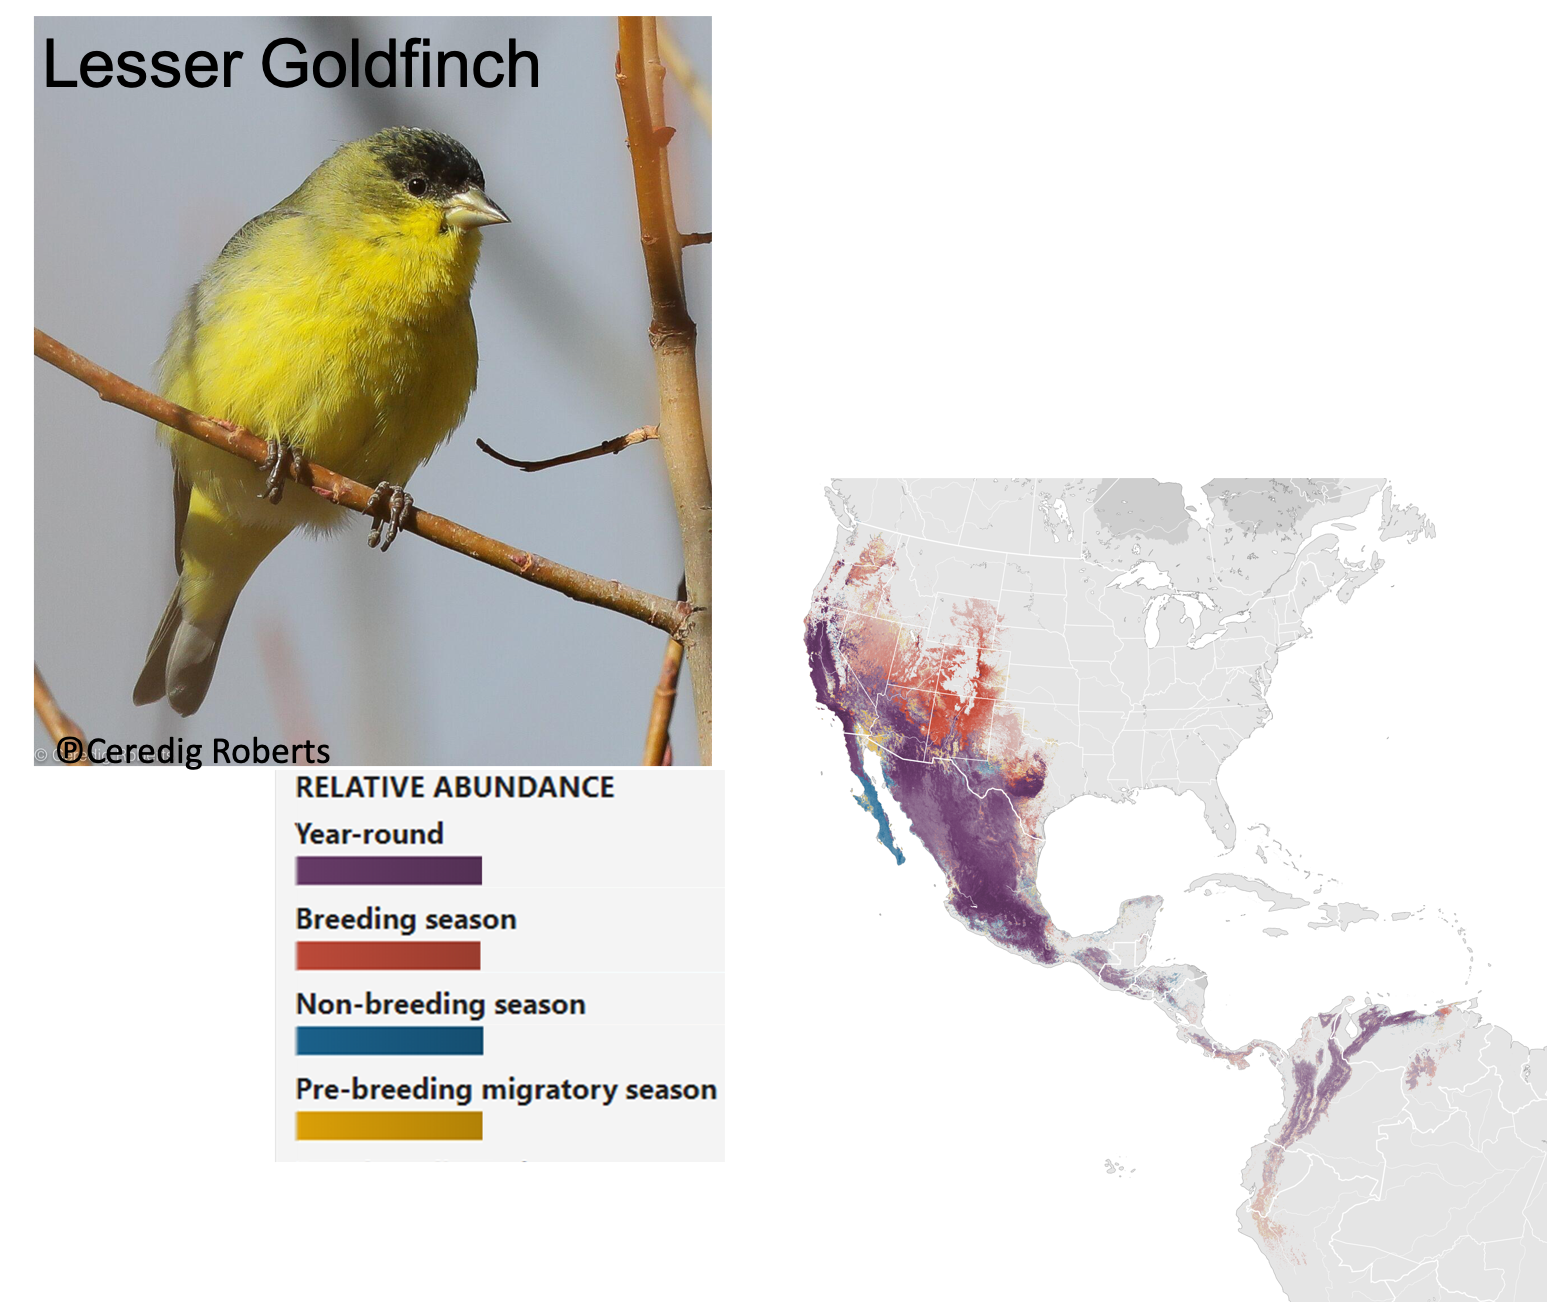
- Bewick’s Wren (Thryomanes bewickii; Below) and Lesser Goldfinch (Spinus psaltria; Right) are polytypic, primarily non-migratory passerines (Order: Passeriformes) whose historical range did not include Idaho. ¹
- Both species have distinct populations and have primarily seen expansion in the subspecies occurring in regions with cooler climates and lush vegetation.¹
- Both species have expanded East from Oregon (Fig. 1 and 2) and more recently from the South and Southeast.¹
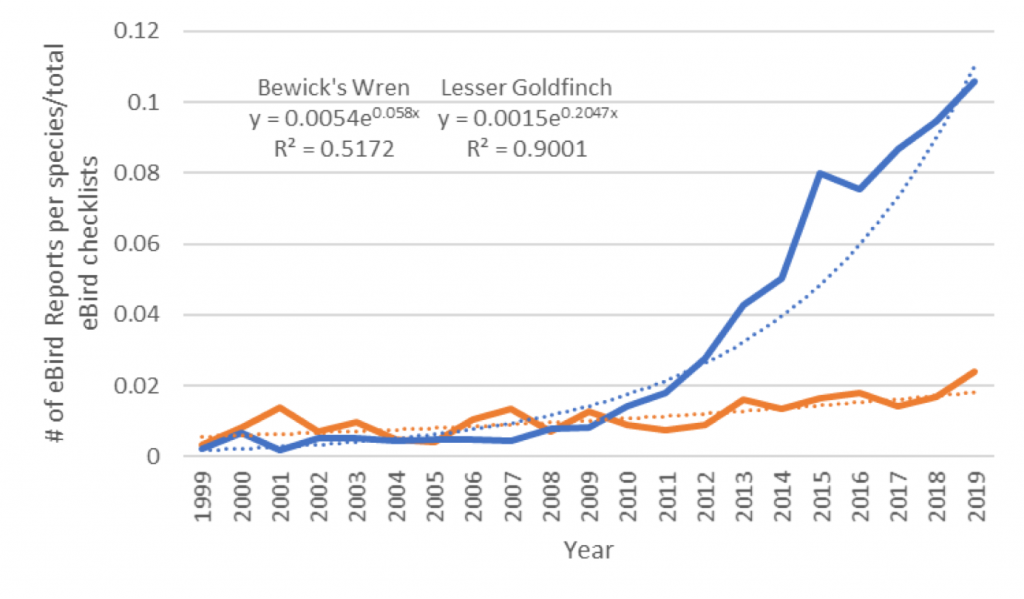
- Both species have increased in relative abundance within Idaho throughout the last decade.
- Here we compare population growth data from eBird with climate data from NOAA to investigate correlation between shifts in Bewick’s Wren and Lesser Goldfinch populations and potential causal factors such as climate change.
Methods
We calculated an index of relative abundance of Bewick’s Wren and Lesser Goldfinch from the eBird Basic Dataset corrected for total effort data in Idaho from 1977 to present. We used exponential trendlines to visualize the rapid and exponential increase in abundance throughout the state.
eBird is the largest biodiversity-related citizen science project in the world with over 100 million sightings reported each year and is run by the Cornell Lab of Ornithology.
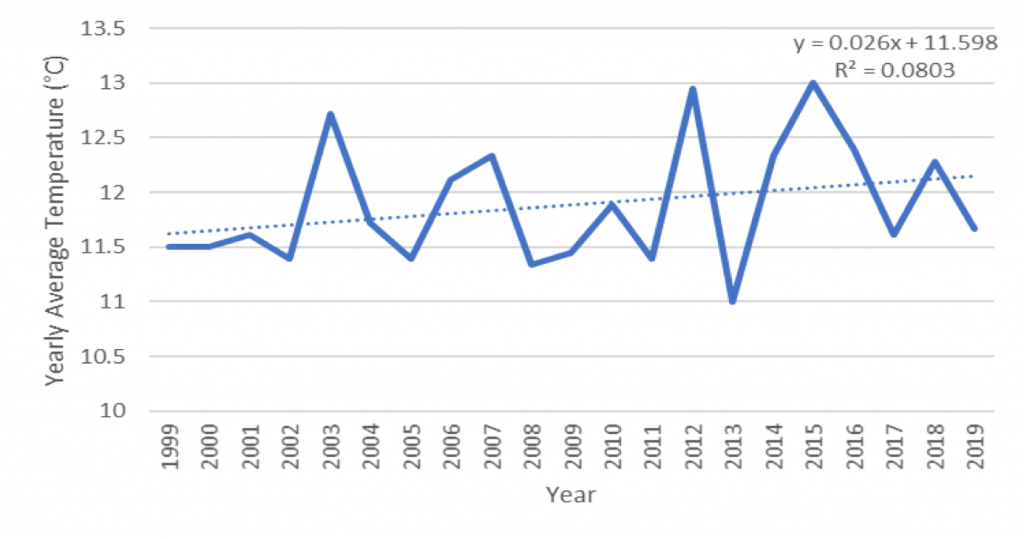
We then plotted historical climate data from the AgACIS database of NOAA Regional Climate Centers and the Boise Air Terminal including minimum, maximum, and average temperatures as well as yearly precipitation from 1976 to 2019.
We then visually compared trends in relative abundance to trends in climate data to investigate potential correlations.
Results
- Both species populations have grown exponentially in Idaho since 1999 (Fig. 3).
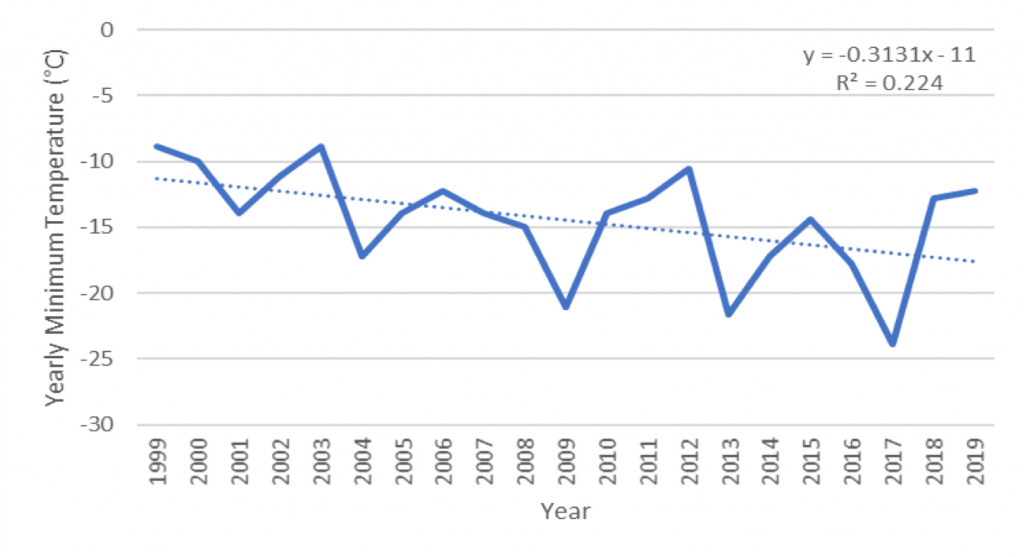
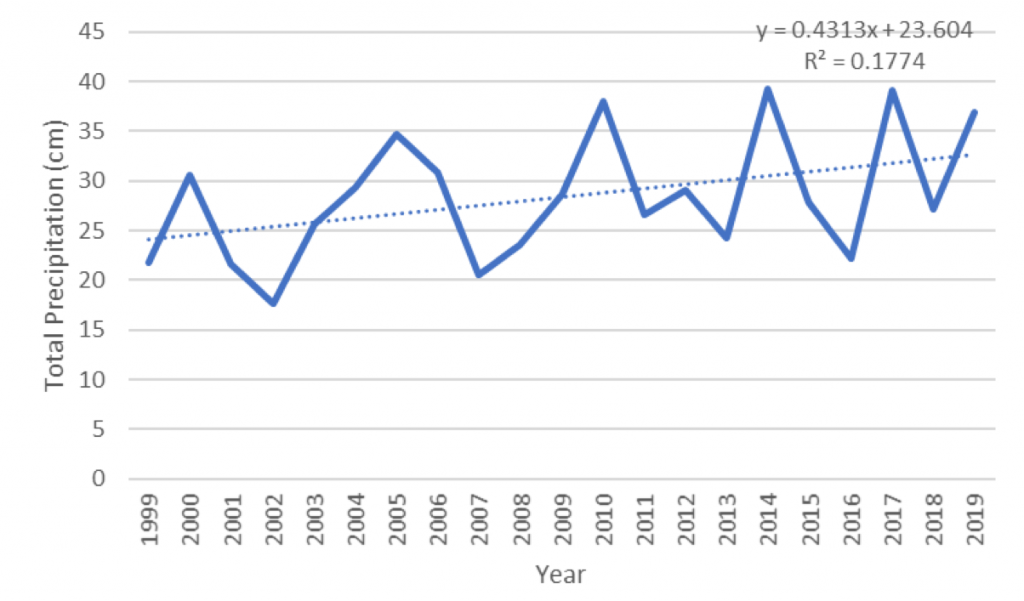
- Climate data has shown only gradual change over the same period of time (Fig. 4, 5, and 6).
Data
Conclusions
- Although both average temperature and total annual precipitation have increased in Idaho (Fig. 4 and 6), these changes are more gradual and do not appear to explain changes in species abundance.
- In support of our preliminary investigation, previous research on a species with similar population changes, Anna’s Hummingbirds (Calypte anna), also found that climate change alone was not enough to explain the rate of range expansion². Greig et al. found that Anna’s range expansion is likely due to a combination of climate change, urbanization, and supplemental feeding².
- We believe that habitat is a likely causal factor for the observed shifts in the populations
- Further investigations should include analysis of changes in habitat and realized niche within the expanded range.
- eBird and other citizen science projects such as Project Feederwatch allow us to examine trends in avian species that would be otherwise impossible.³
Literature Cited
- S. M. Billerman, B. K. Keeney, P. G. Rodewald, and T. S. Schulenberg (Editors) (2020). Birds of the World. Cornell Laboratory of Ornithology, Ithaca, NY, USA. https://birdsoftheworld.org/bow/home
- Greig E.I, Wood E.M., Bonter D.N. (2017). Winter range expansion of a hummingbird is associated with urbanization and supplementary feeding. Proc. R. Soc. B
- Job, J. and Bednekoff, P.A. (2011). Wrens on the edge: feeders predict Carolina wren Thryothorus ludovicianusabundance at the northern edge of their range. Journal of Avian Biology, 42: 16-21. doi:10.1111/j.1600-048X.2010.05242.x
Additional Information
For questions or comments about this research, contact Carter Strope at carterstrope@u.boisestate.edu.