by Eli Woodard
Involved group of researchers: Nancy Glenn, Brent Wilder, and other members of the research team in the Owyhee Mountains in southern Idaho.
“Seasonal snowpacks are changing at an unprecedented rate globally. A major component to modeling our snowpacks is the albedo term. Unfortunately, we don’t really have a lot of great data around the globe – especially datasets with a long record,” said researcher Brent Wilder.
Wilder, under the supervision of PI Nancy Glenn, is working on a NASA FINESST-funded project aimed at modeling snow albedo from imaging spectroscopy using a new global algorithm. This algorithm is designed to be faster and more accurate, providing valuable data for other researchers and regional hydrology models.
The team uses imaging spectroscopy data from the Italian Space Agency (ASI) via the satellite PRISMA. These images show surface reflectance across a wide EM spectrum (400 – 2,500nm). The information, along with solar geometries and land cover data, is used to solve simultaneous numerical optimization problems across the image to search for snow albedo. The algorithm has also been updated to allow for NASA’s new EMIT sensor.
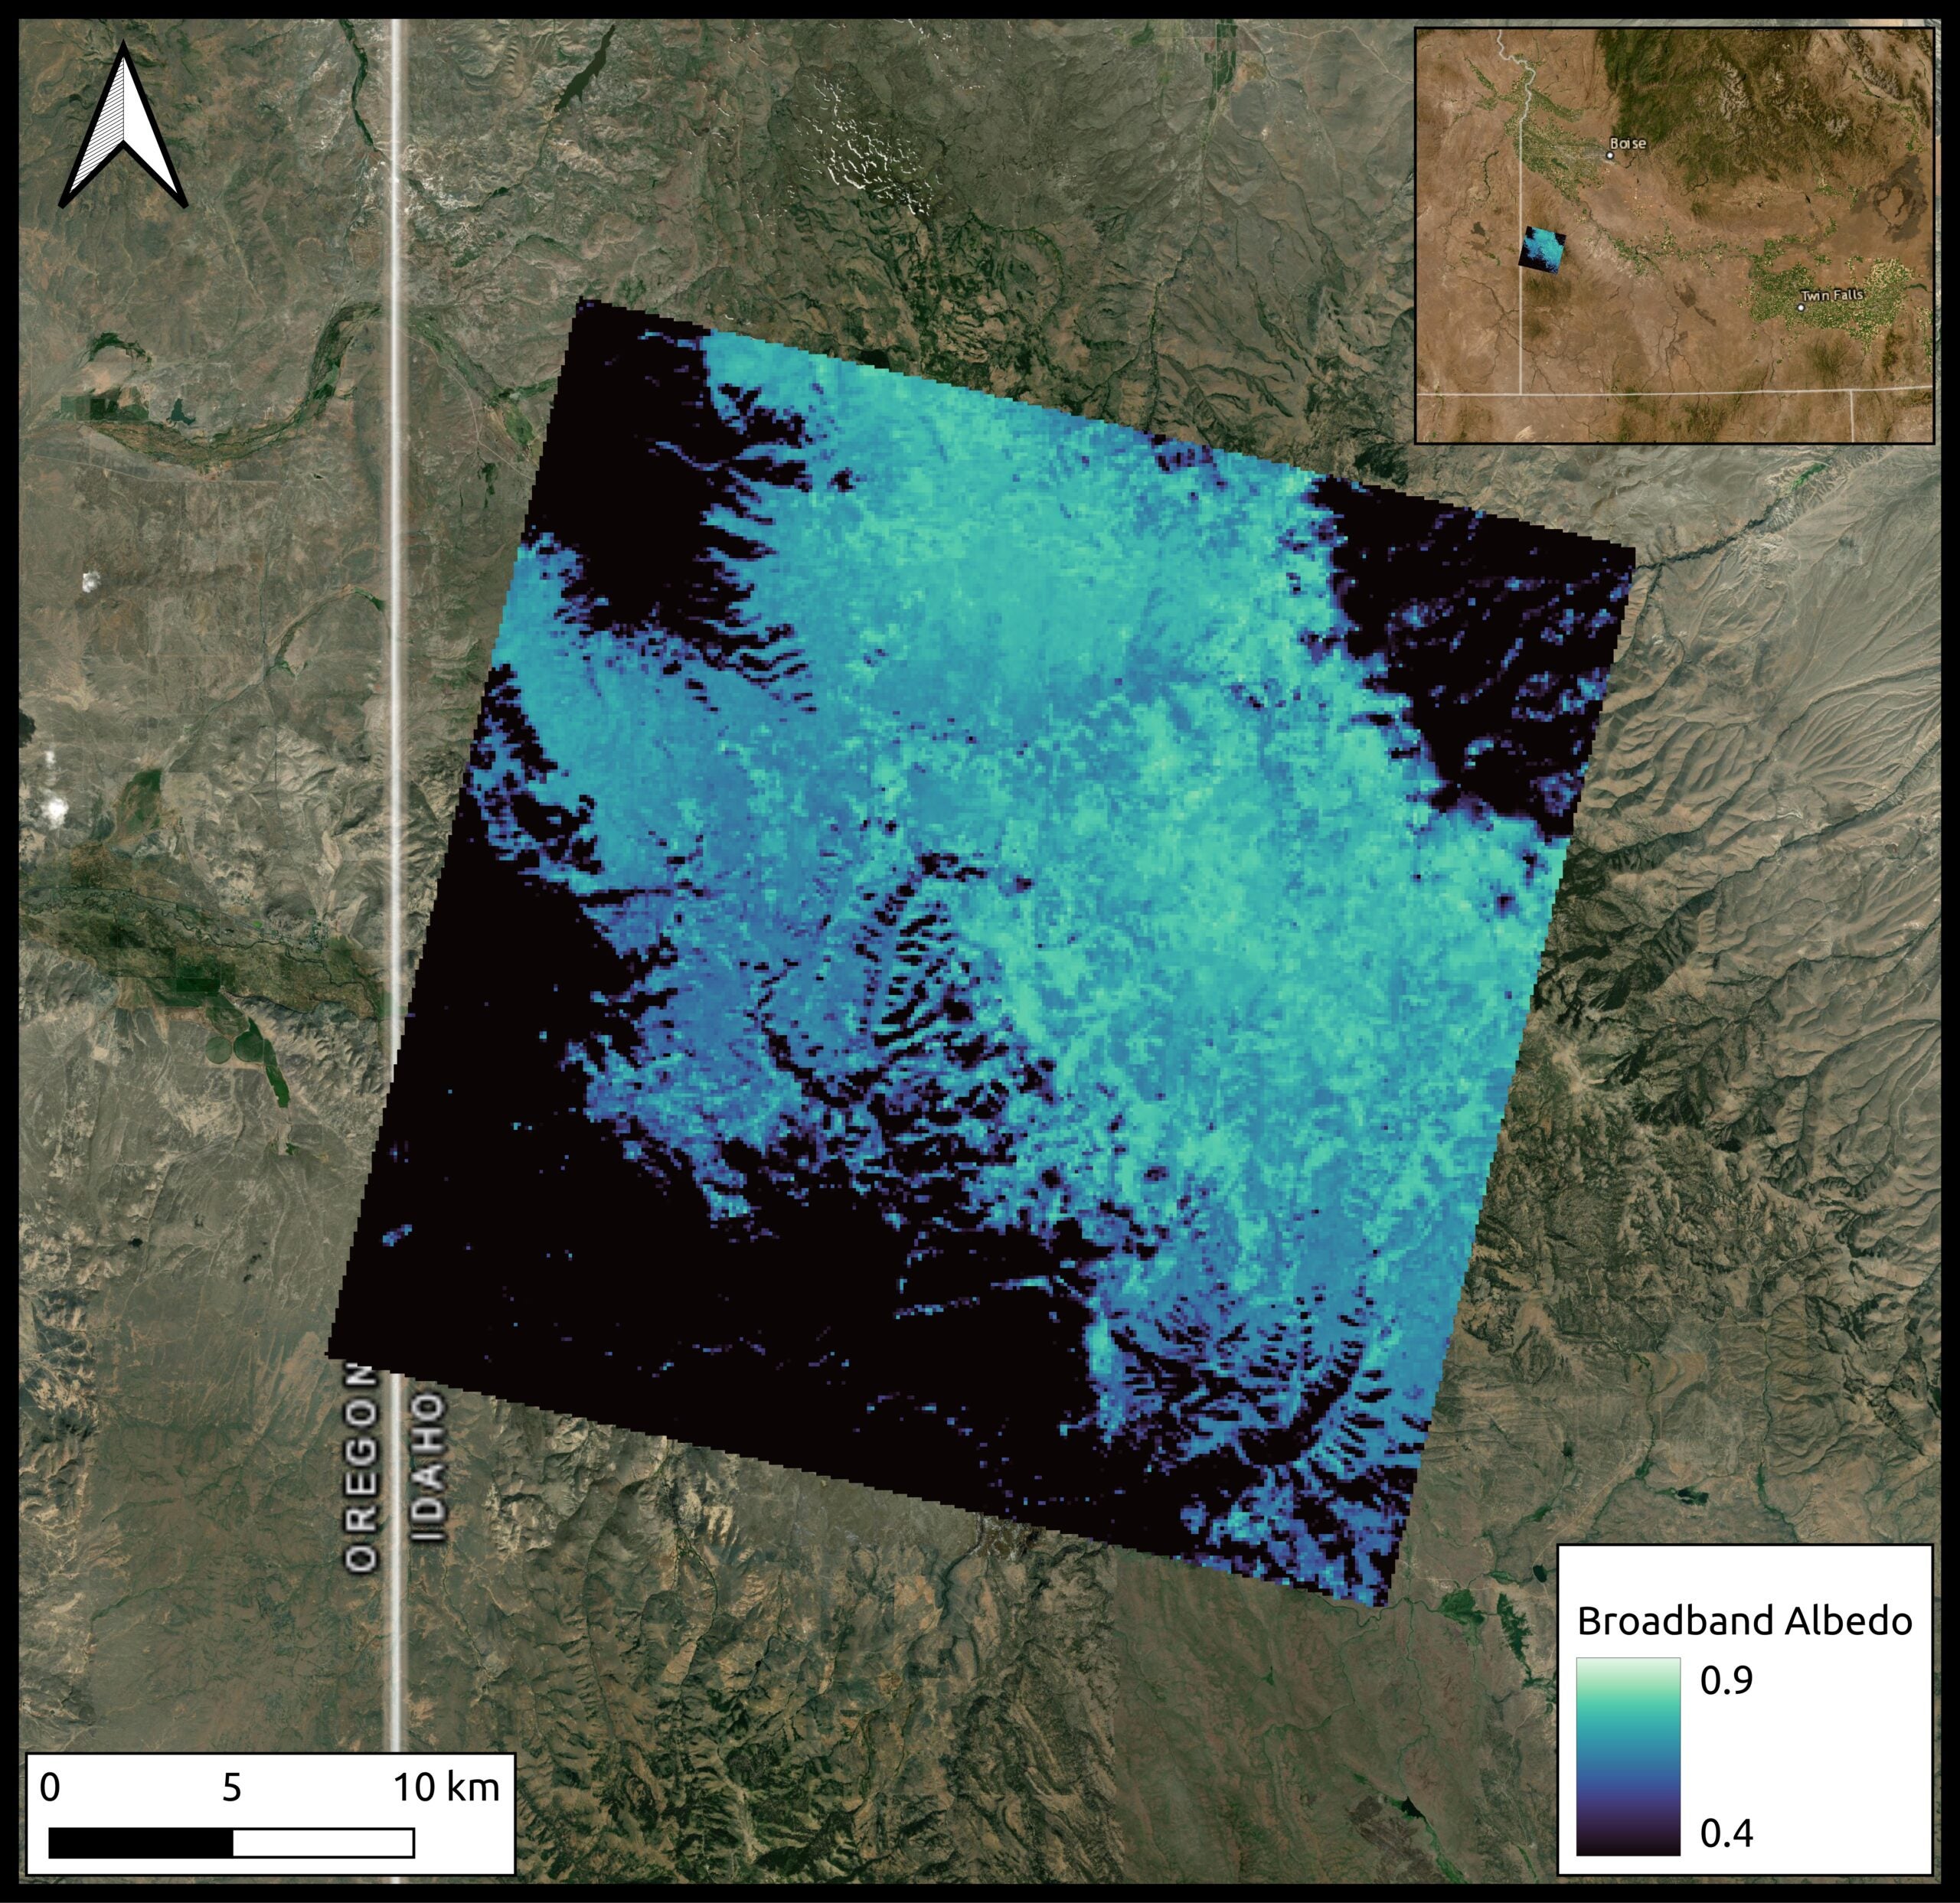
The above figure is a composite of a satellite view of a landscape and an overlaid scientific data visualization. The main portion of the image shows a top-down satellite view of rugged terrain with varying shades of brown and green, indicative of a natural, possibly mountainous area. There’s a clear demarcation where the satellite imagery ends, and the overlaid data begins.
The overlaid data appears to be a heat map ranging from dark blue to light blue shades, representing a spectrum of values for “Broadband Albedo” as indicated by the scale at the bottom right corner, which ranges from 0.4 to 0.9. The term “Broadband Albedo” generally refers to the fraction of solar energy reflected from the Earth back into space. The scale and variations suggest differences in reflectivity across the landscape, with the darker areas possibly being more absorbent and the lighter areas more reflective.
A small inset map in the upper right corner shows a broader view of the region, highlighting the specific area of interest with a rectangle, providing context within a larger geographic area that includes parts of Oregon and Idaho.
At the bottom of the image, there is a scale bar that provides a reference for distance, marked at 0, 5, and 10 kilometers, helping to gauge the size of the area displayed in the satellite image.
The image is likely used for scientific or environmental monitoring purposes, combining direct visual satellite imagery with data visualization to analyze the Earth’s surface characteristics.
Wilder explained, “The biggest challenge was the computational hurdle. But once that was passed, there was then the issue of too many pixels to optimize and the algorithm simply taking too long to be really useful. This prompted my idea to use unsupervised learning to speed up the algorithm,”.
The turning point for this research was changing the strategy from multiprocessing on one node to distributing to many nodes using MPI, thanks to the help of Frank Willmore working at OIT. This approach made the image processing algorithm more efficient and scalable for global satellites.
This research is just the beginning, with a lot of work set to build off of this, thanks to data being collected by CRREL, NASA SnowEx, ARS, and USGS. Uncertainty estimation is a major component of the proposed work, making these partnerships incredibly vital for assessing the model.
The team hopes to share their open-source Python package with the scientific community later this fall with the accompanying manuscript. This work contributes to the broader field of climatology and has potential applications in understanding and predicting changes in global snowpacks.
To find out how Research Computing can help with a project, email researchcomputing@boisestate.edu