This dashboard contains facts and figures about the state of the housing market across Idaho, usually broken down by county.
Navigating the Dashboard
Within the dashboard frame are the following tabs that you can select to access a new set of pages of content for that subject:
- Households
- Housing
- Values & Prices
- Employment
Select the dropdown menus scattered throughout the dashboard to explore and compare different categories on the same visual. Most tabs will allow you to click a county on the associated county map in order to show data on that specific county.
Screen Reader Support
This dashboard was created with Tableau. Please review their documentation for tips on navigating the dashboard with a keyboard. You can also navigate to the Download button to download a Crosstab version of the data or review the Housing Analysis Infographic section of this page for an overview of the report.
Housing Analysis Infographic
Content on this site is monitored for compliance with WCAG 2.0 standards. We are continuously improving the usability of our content and are actively working to provide a more inclusive experience for all. Please, contact the Idaho Policy Institute immediately if you encounter any access barriers, challenges, or require the content in another format to fully access the information.
Click here to download a pdf infographic of the information below
Housing is a critical part of Idaho’s Infrastructure
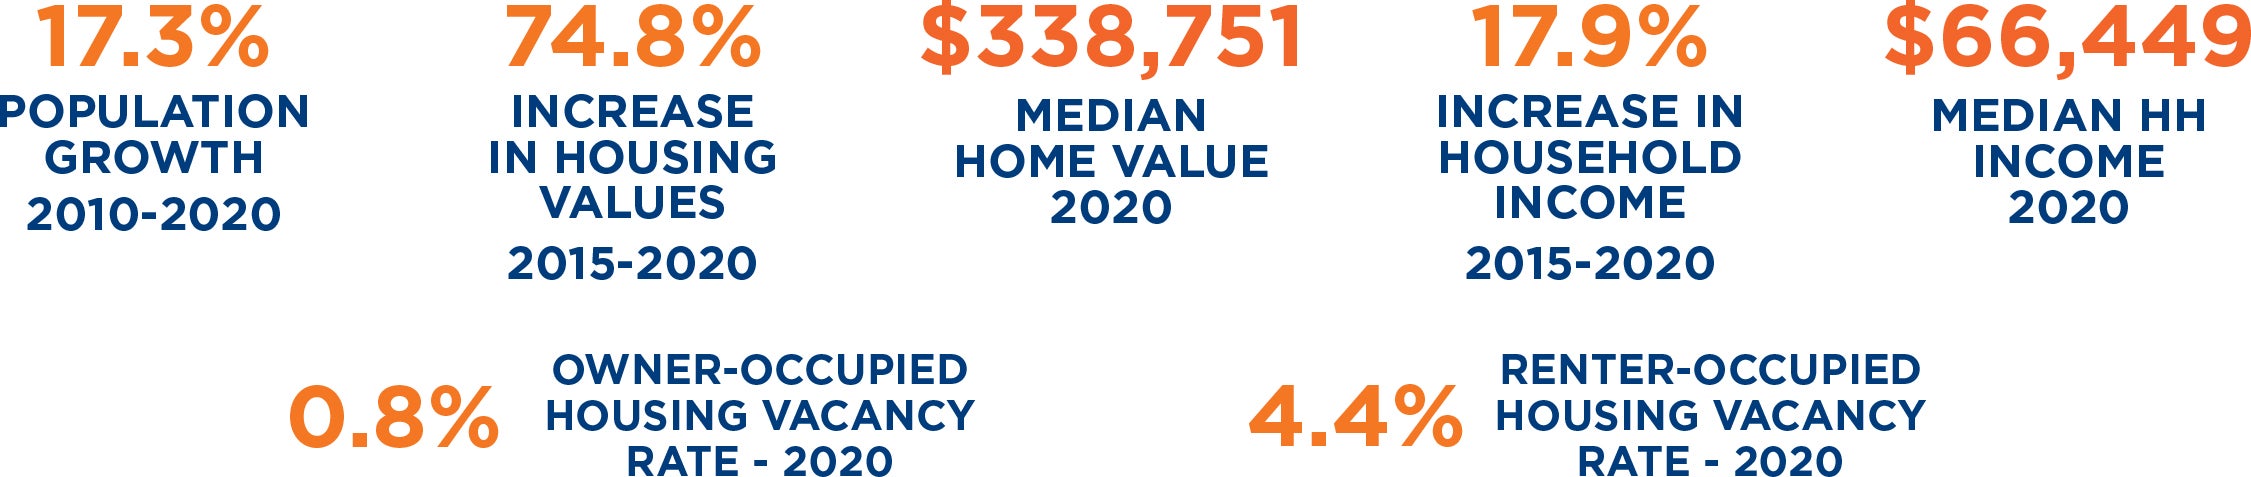
Domestic migration away from the nation’s large metropolitan areas is affecting small- and mid-sized regions across the United States. As a result, since 2010, Idaho’s population has grown 17.3%, making it the second fastest growing state in the nation. Housing stock hasn’t kept pace; 2020 vacancy rates for owneroccupied housing (0.8%) and renter-occupied housing (4.4%) are below the national average. Since 2015, Idaho housing values have increased 74.8% while median household income has increased 17.9%. This all has resulted in 26.6% of Idaho households (42.1% of renters and 25.7% of home owners with a mortgage) paying 30% or more of their income on housing costs. These cost burdened households are more likely than other households to sacrifice necessities (such as food, transportation, and healthcare) in order to pay for housing costs, and they are also more likely to experience housing instability and evictions. Cost burdened households are reflected in all income brackets and in all of Idaho’s 44 counties.
Percentage of Income on Housing Costs
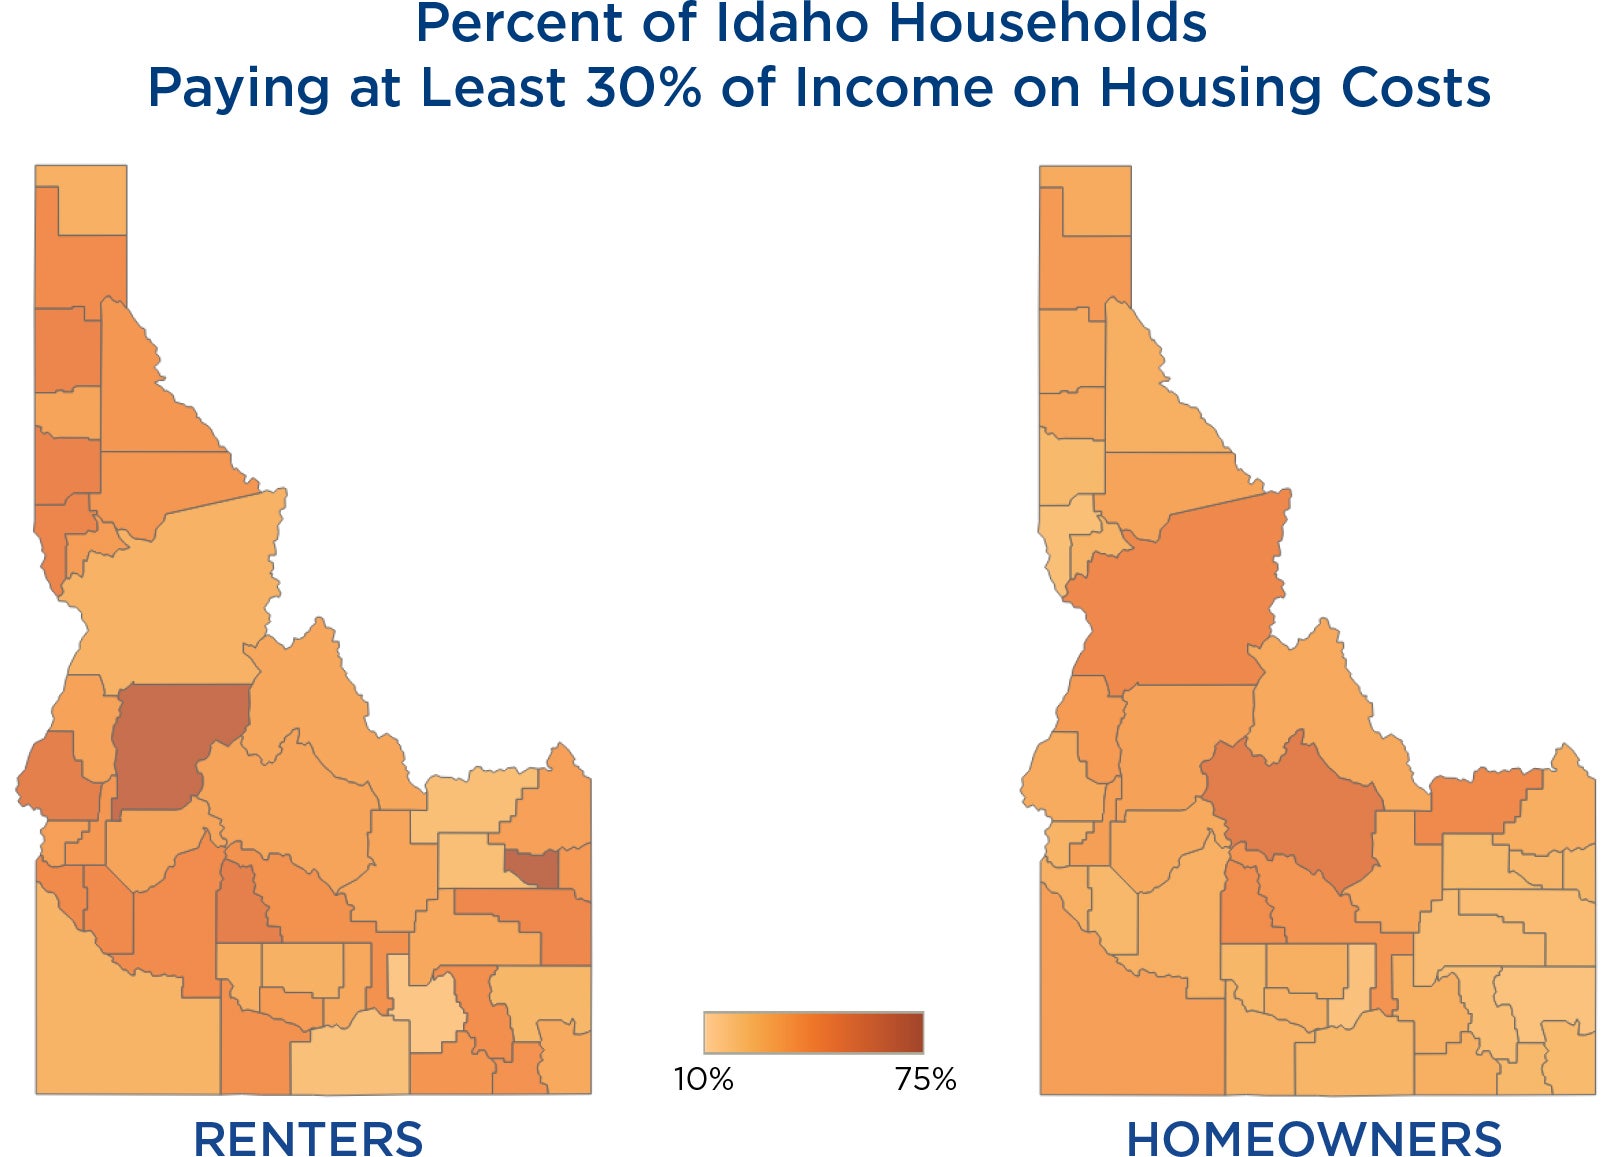
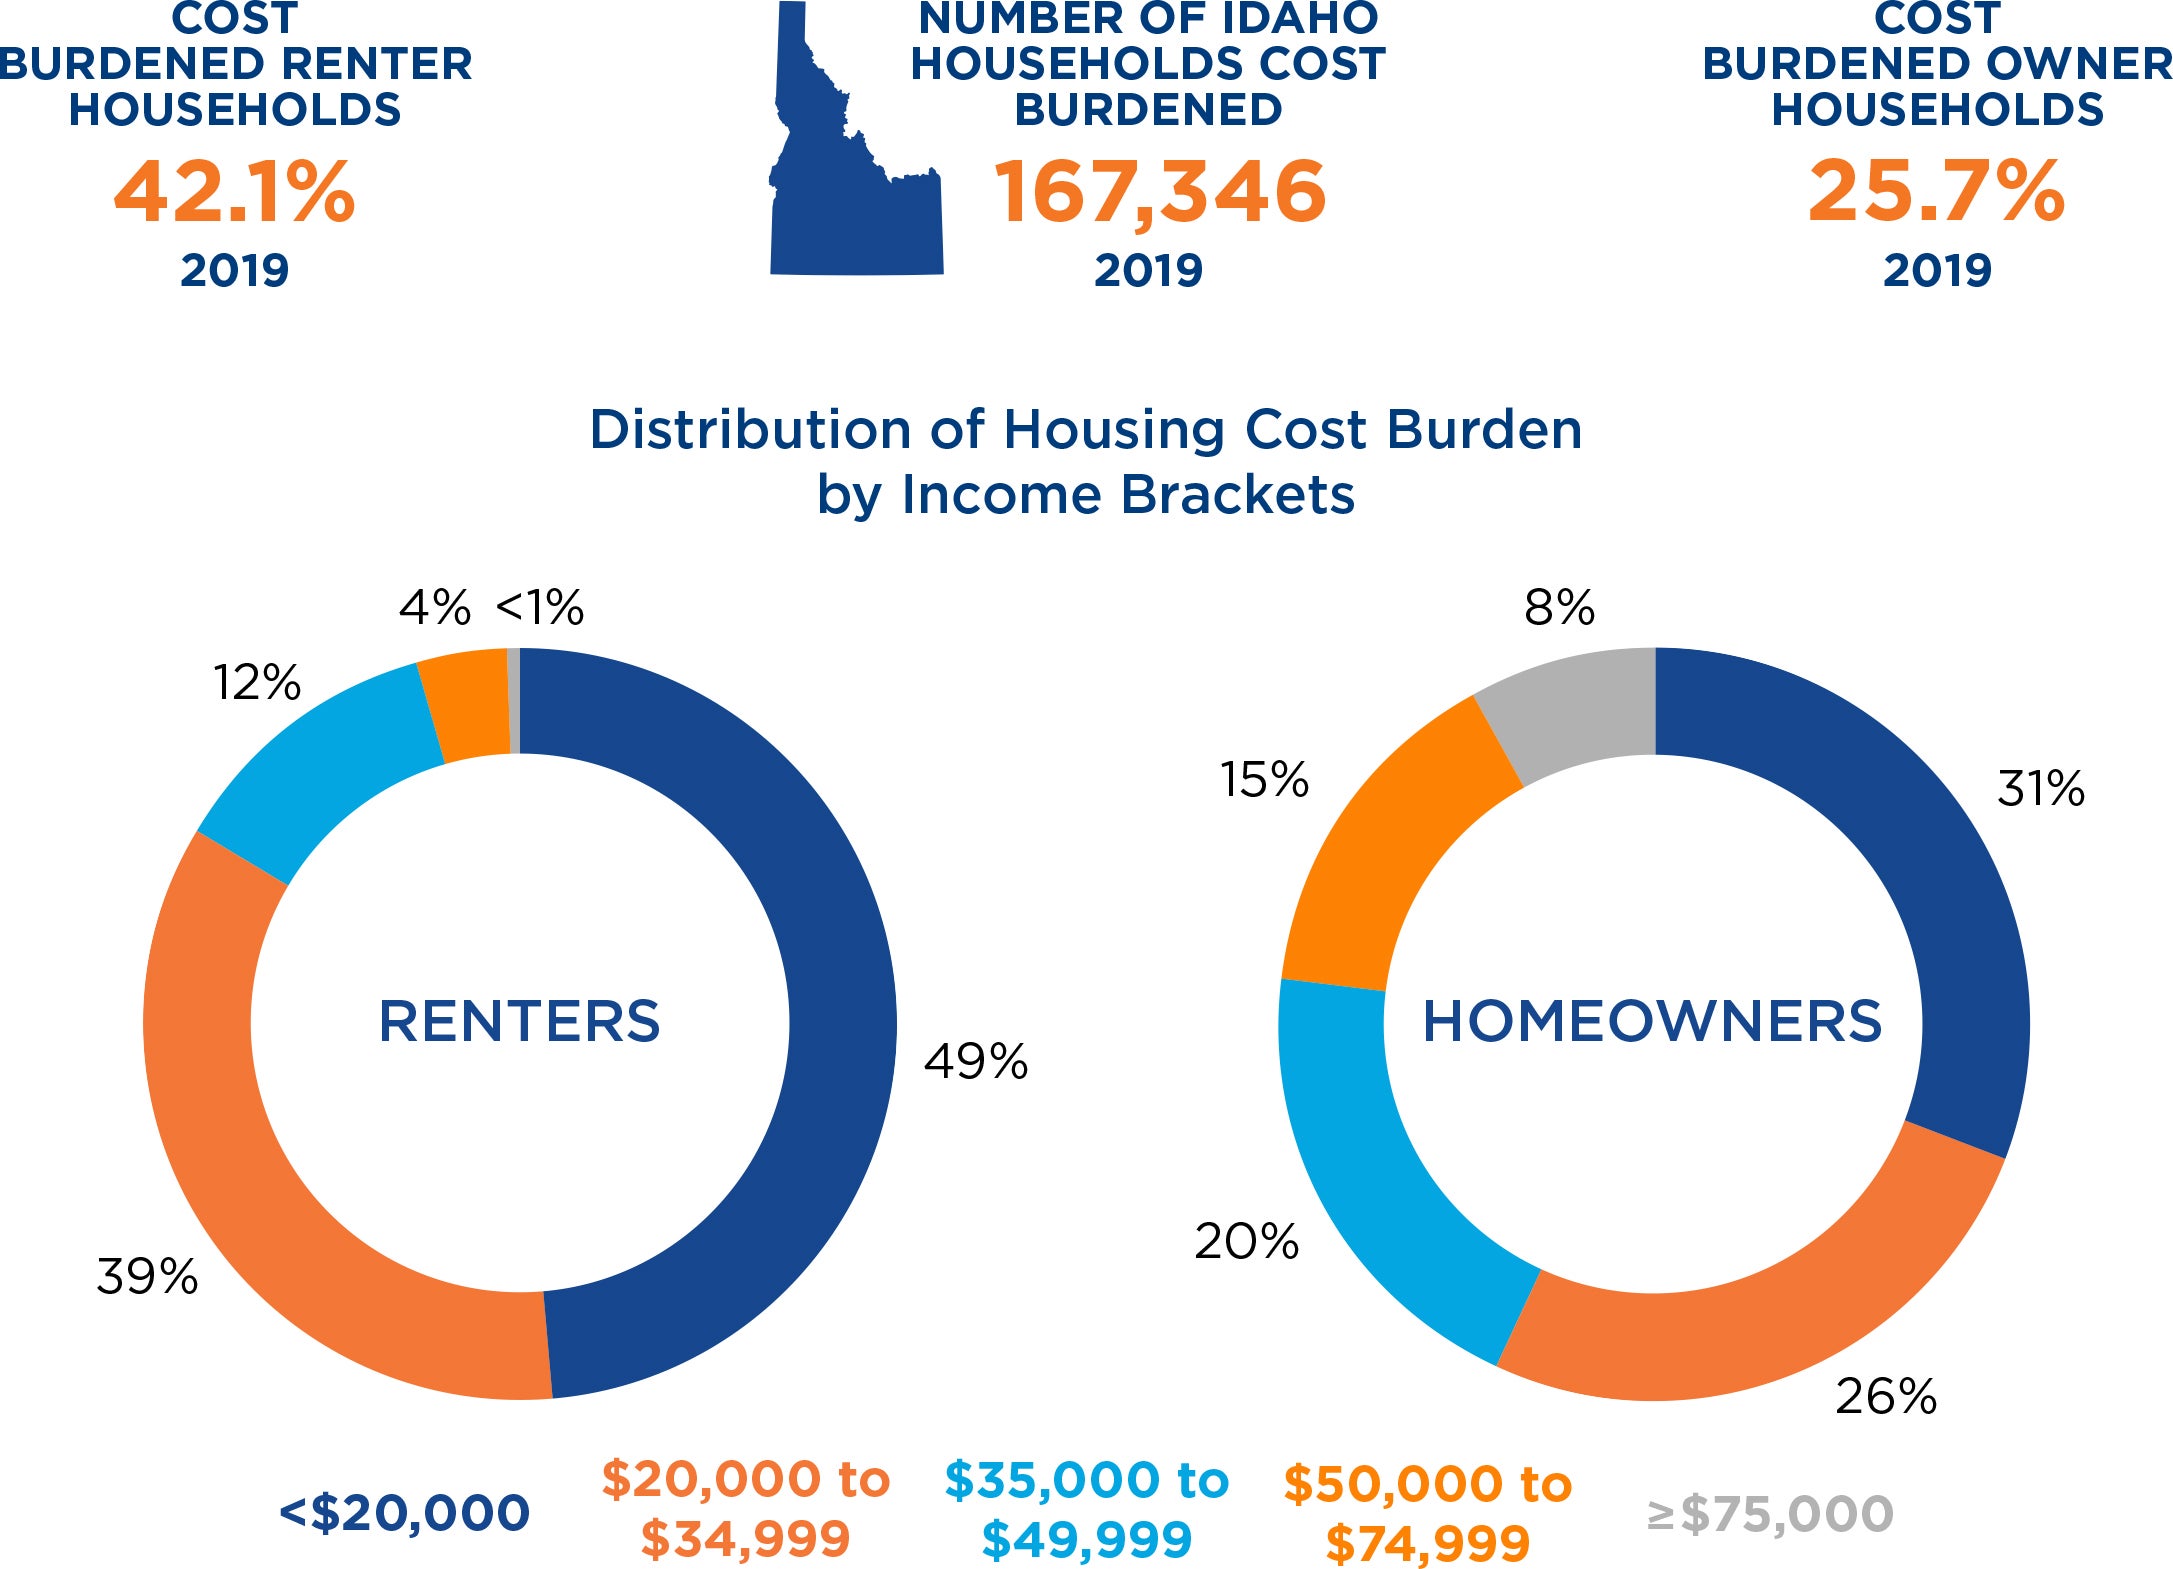
Cost Burden
Households that spend 30 percent or more of household income on housing are considered cost burdened. These households devote too great a proportion of their budget to housing and are often unable to pay for other necessities, like food, transportation, or healthcare. The charts below show that cost burden disproportionately affects Idaho renters and lower income households.
Conclusion
As Idaho’s population has grown, housing has become more scarce and more expensive. This impacts Idaho households across income brackets and in all 44 counties. It also impacts Idaho’s economy. Cost burdened households have limited spending power and struggle to pay for necessities, such as childcare, healthcare, and groceries. Limited access to housing that is affordable across income levels reduces employers’ ability to attract and retain talent, and also limits greater tax generation, creation of jobs, opportunities for economic development, and increased job productivity.
Idaho Policy Institute
Vanessa Crossgrove Fry, MBA, PhD, Interim Director
Lantz McGinnis-Brown, MPA, Research Associate
Cheong Kim, PhD, Research Scholar
Matthew May, PhD, Research Scholar
Information on methodology and citations available at:
boisestate.edu/sps-ipi/