Elizabeth Crowther, Dr. James McNamara, Pamella A. Cedillo, P.G.
Introduction
The Samaria Mountains southwest of Malad, Idaho are considered a recharge area for the the Malad River Basin (Hurlow, 2016). this area has been continually excluded from studies of the Malad River Basin. (Pluhowski 1970, Hurlow 2016).
Over the course of the last three years, the Bureau of Land Management State Office Water Rights Department has been surveying water sources on BLM land within the Bear River Adjudication. Measuring springs and stream consistency is crucial for BLM management practices (Barquin 2008). Understanding the complex recharge rates for springs on BLM land assists in determining the reliance of that stream throughout the year and dry seasons.
Research Goal
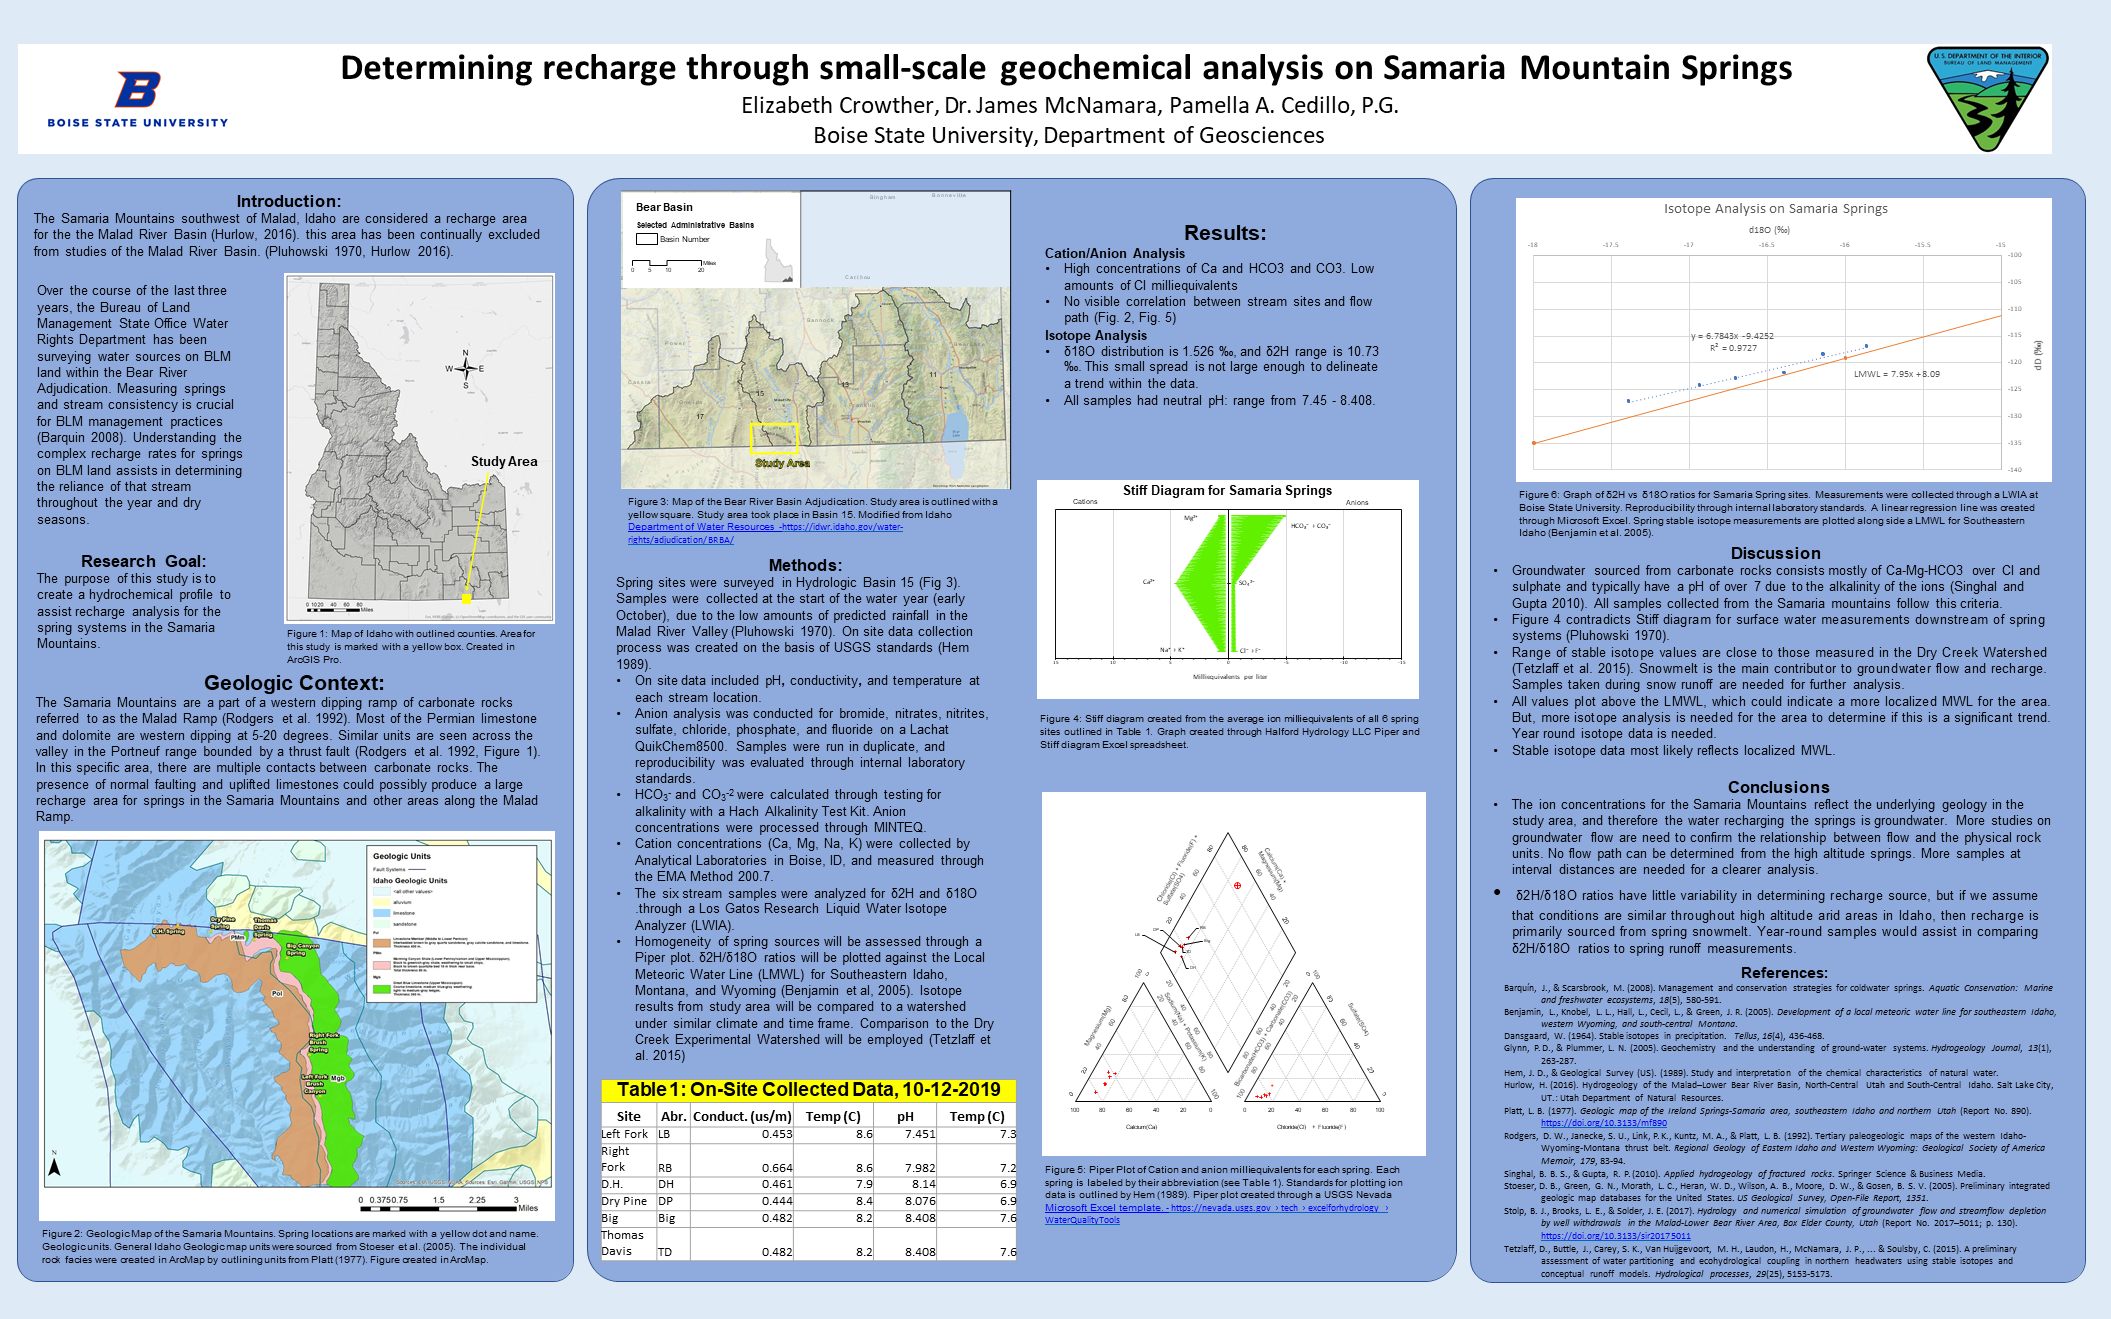
The purpose of this study is to create a hydrochemical profile to assist recharge analysis for the spring systems in the Samaria Mountains.
Geologic Context
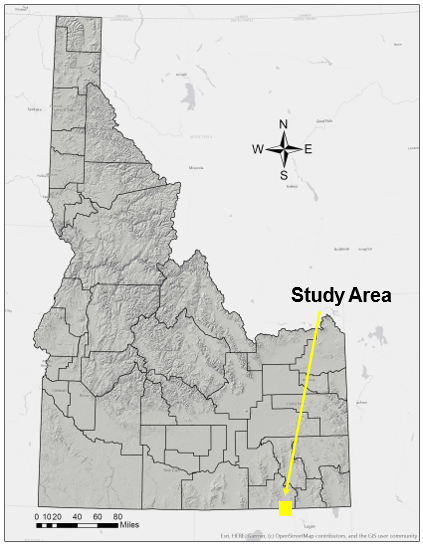
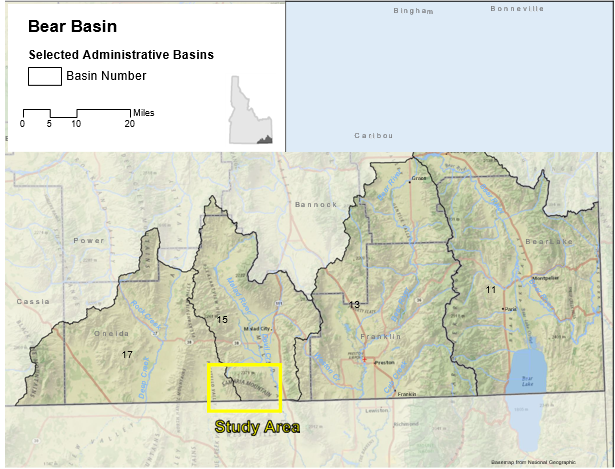
The Samaria Mountains are a part of a western dipping ramp of carbonate rocks referred to as the Malad Ramp (Rodgers et al. 1992). Most of the Permian limestone and dolomite are western dipping at 5-20 degrees. Similar units are seen across the valley in the Portneuf range bounded by a thrust fault (Rodgers et al. 1992, Figure 1). In this specific area, there are multiple contacts between carbonate rocks. The presence of normal faulting and uplifted limestones could possibly produce a large recharge area for springs in the Samaria Mountains and other areas along the Malad Ramp.
Methods
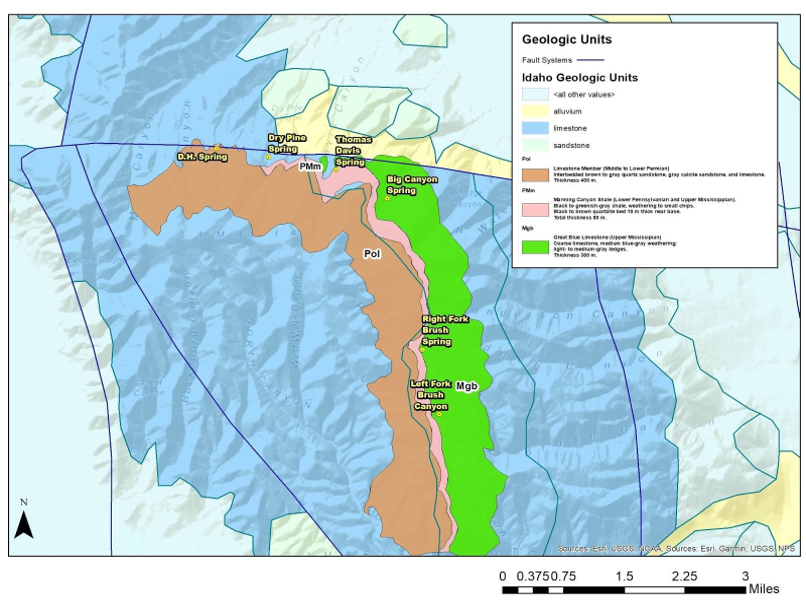
Spring sites were surveyed in Hydrologic Basin 15 (Fig 3). Samples were collected at the start of the water year (early October), due to the low amounts of predicted rainfall in the Malad River Valley (Pluhowski 1970). On site data collection process was created on the basis of USGS standards (Hem 1989).
- On site data included pH, conductivity, and temperature at each stream location.
- Anion analysis was conducted for bromide, nitrates, nitrites, sulfate, chloride, phosphate, and fluoride on a Lachat QuikChem8500. Samples were run in duplicate, and reproducibility was evaluated through internal laboratory standards.
- HCO3– and CO3-2 were calculated through testing for alkalinity with a Hach Alkalinity Test Kit. Anion concentrations were processed through MINTEQ.
- Cation concentrations (Ca, Mg, Na, K) were collected by Analytical Laboratories in Boise, ID, and measured through the EMA Method 200.7.
- The six stream samples were analyzed for δ2H and δ18O
.through a Los Gatos Research Liquid Water Isotope Analyzer (LWIA). - Homogeneity of spring sources will be assessed through a Piper plot. δ2H/δ18O ratios will be plotted against the Local Meteoric Water Line (LMWL) for Southeastern Idaho, Montana, and Wyoming (Benjamin et al, 2005). Isotope results from study area will be compared to a watershed under similar climate and time frame. Comparison to the Dry Creek Experimental Watershed will be employed (Tetzlaff et al. 2015)
Table 1: On-Site Collected Data, 10-12-2019
| Site | Abr. | Conduct. (us/m) | Temp (C) | pH | Temp (C) |
|---|---|---|---|---|---|
| Left Fork | LB | 0.453 | 8.6 | 7.451 | 7.3 |
| Right Fork | RB | 0.664 | 8.6 | 7.982 | 7.2 |
| D.H. | DH | 0.461 | 7.9 | 8.14 | 6.9 |
| Dry Pine | DP | 0.444 | 8.4 | 8.076 | 6.9 |
| Big | Big | 0.482 | 8.2 | 8.408 | 7.6 |
| Thomas Davis | TD | 0.482 | 8.2 | 8.408 | 7.6 |
Results
Cation/Anion Analysis
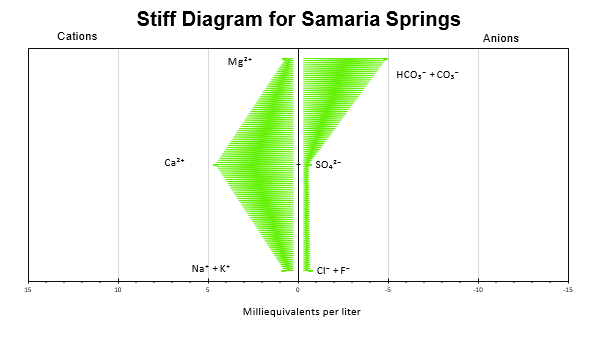
- High concentrations of Ca and HCO3 and CO3. Low amounts of Cl milliequivalents
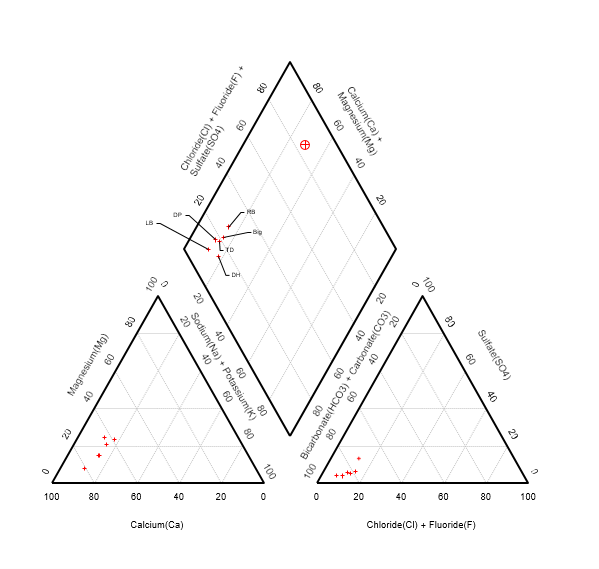
- No visible correlation between stream sites and flow path (Fig. 2, Fig. 5)
Isotope Analysis
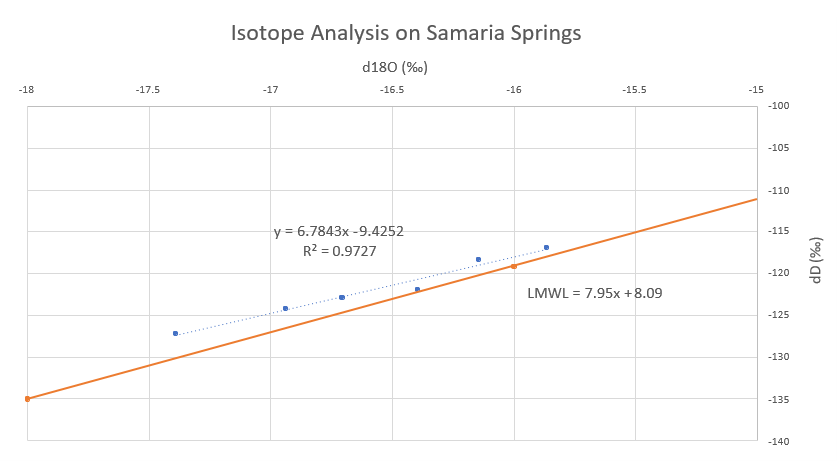
- δ18O distribution is 1.526 ‰, and δ2H range is 10.73
‰. This small spread is not large enough to delineate a trend within the data. - All samples had neutral pH: range from 7.45 – 8.408.
Discussion
- Groundwater sourced from carbonate rocks consists mostly of Ca-Mg-HCO3 over Cl and sulphate and typically have a pH of over 7 due to the alkalinity of the ions (Singhal and Gupta 2010). All samples collected from the Samaria mountains follow this criteria.
Figure 4 contradicts Stiff diagram for surface water measurements downstream of spring systems (Pluhowski 1970). - Range of stable isotope values are close to those measured in the Dry Creek Watershed (Tetzlaff et al. 2015). Snowmelt is the main contributor to groundwater flow and recharge. Samples taken during snow runoff are needed for further analysis.
- All values plot above the LMWL, which could indicate a more localized MWL for the area. But, more isotope analysis is needed for the area to determine if this is a significant trend. Year round isotope data is needed.
- Stable isotope data most likely reflects localized MWL.
Conclusions
The ion concentrations for the Samaria Mountains reflect the underlying geology in the study area, and therefore the water recharging the springs is groundwater. More studies on groundwater flow are need to confirm the relationship between flow and the physical rock units. No flow path can be determined from the high altitude springs. More samples at interval distances are needed for a clearer analysis.
δ2H/δ18O ratios have little variability in determining recharge source, but if we assume that conditions are similar throughout high altitude arid areas in Idaho, then recharge is primarily sourced from spring snowmelt. Year-round samples would assist in comparing δ2H/δ18O ratios to spring runoff measurements.
References
- Barquín, J., & Scarsbrook, M. (2008). Management and conservation strategies for coldwater springs. Aquatic Conservation: Marine and freshwater ecosystems, 18(5), 580-591.
- Benjamin, L., Knobel, L. L., Hall, L., Cecil, L., & Green, J. R. (2005). Development of a local meteoric water line for southeastern Idaho, western Wyoming, and south-central Montana.
- Dansgaard, W. (1964). Stable isotopes in precipitation. Tellus, 16(4), 436-468.
- Glynn, P. D., & Plummer, L. N. (2005). Geochemistry and the understanding of ground-water systems. Hydrogeology Journal, 13(1), 263-287.
- Hem, J. D., & Geological Survey (US). (1989). Study and interpretation of the chemical characteristics of natural water.
- Hurlow, H. (2016). Hydrogeology of the Malad–Lower Bear River Basin, North-Central Utah and South-Central Idaho. Salt Lake City, UT.: Utah Department of Natural Resources.
- Platt, L. B. (1977). Geologic map of the Ireland Springs-Samaria area, southeastern Idaho and northern Utah (Report No. 890). https://doi.org/10.3133/mf890
- Rodgers, D. W., Janecke, S. U., Link, P. K., Kuntz, M. A., & Platt, L. B. (1992). Tertiary paleogeologic maps of the western Idaho- Wyoming-Montana thrust belt. Regional Geology of Eastern Idaho and Western Wyoming: Geological Society of America Memoir, 179, 83-94.
- Singhal, B. B. S., & Gupta, R. P. (2010). Applied hydrogeology of fractured rocks. Springer Science & Business Media.
- Stoeser, D. B., Green, G. N., Morath, L. C., Heran, W. D., Wilson, A. B., Moore, D. W., & Gosen, B. S. V. (2005). Preliminary integrated geologic map databases for the United States. US Geological Survey, Open-File Report, 1351.
- Stolp, B. J., Brooks, L. E., & Solder, J. E. (2017). Hydrology and numerical simulation of groundwater flow and streamflow depletion by well withdrawals in the Malad-Lower Bear River Area, Box Elder County, Utah (Report No. 2017–5011; p. 130). https://doi.org/10.3133/sir20175011
- Tetzlaff, D., Buttle, J., Carey, S. K., Van Huijgevoort, M. H., Laudon, H., McNamara, J. P., … & Soulsby, C. (2015). A preliminary assessment of water partitioning and ecohydrological coupling in northern headwaters using stable isotopes and conceptual runoff models. Hydrological processes, 29(25), 5153-5173.
Additional Information
For questions or comments about this research, contact Elizabeth Crowther at elizabethcrowther@u.boisestate.edu.