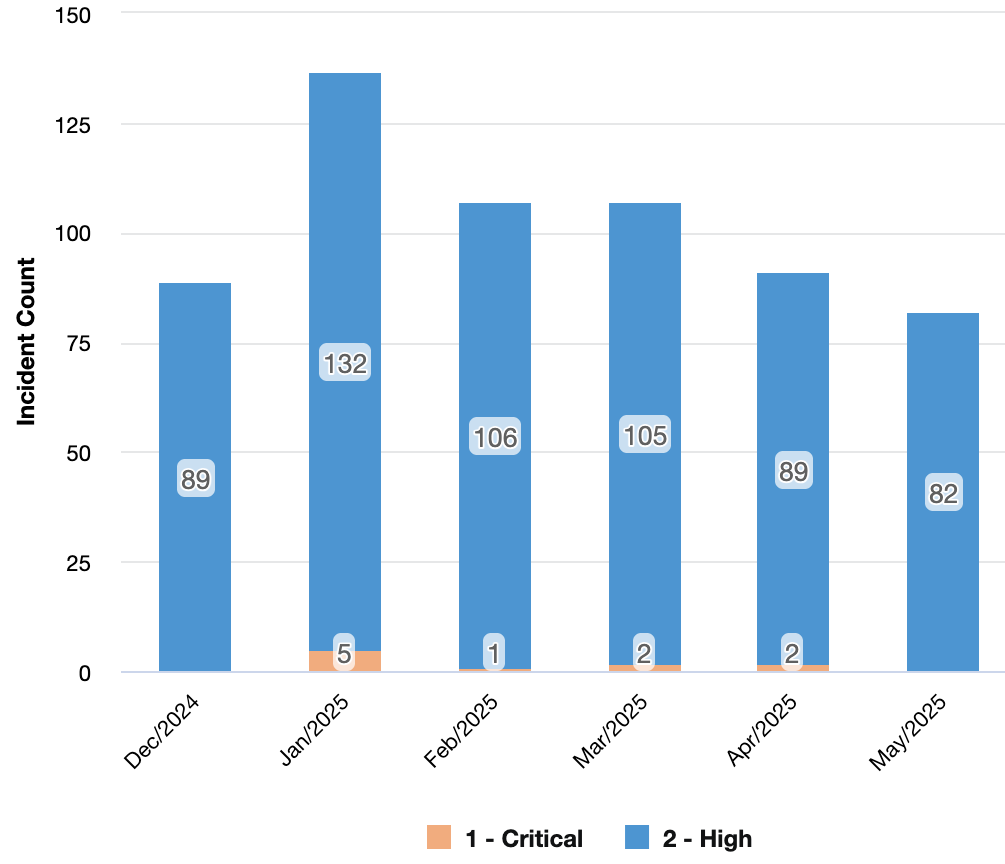
Number of incidents by priority metric for December 2024 through May 2025
About this metric
Incident priority is determined by assessing its impact and urgency.
Critical priority
Defined as a “show-stopper” with no workarounds. An example would be the university community reporting they are unable to sign in to Canvas.
High priority
Defined as impacts to a major system that seriously degrades the customer experience. An example would be students reporting they are unable to access the Student View in myBoiseState.
December 2024
- High: 89
- Critical: 0
January 2025
- High: 132
- Critical: 5
February 2025
- High: 106
- Critical: 1
March 2025
- High: 105
- Critical: 2
April 2025
- High: 89
- Critical: 2
May 2025
- High: 82
- Critical: 0