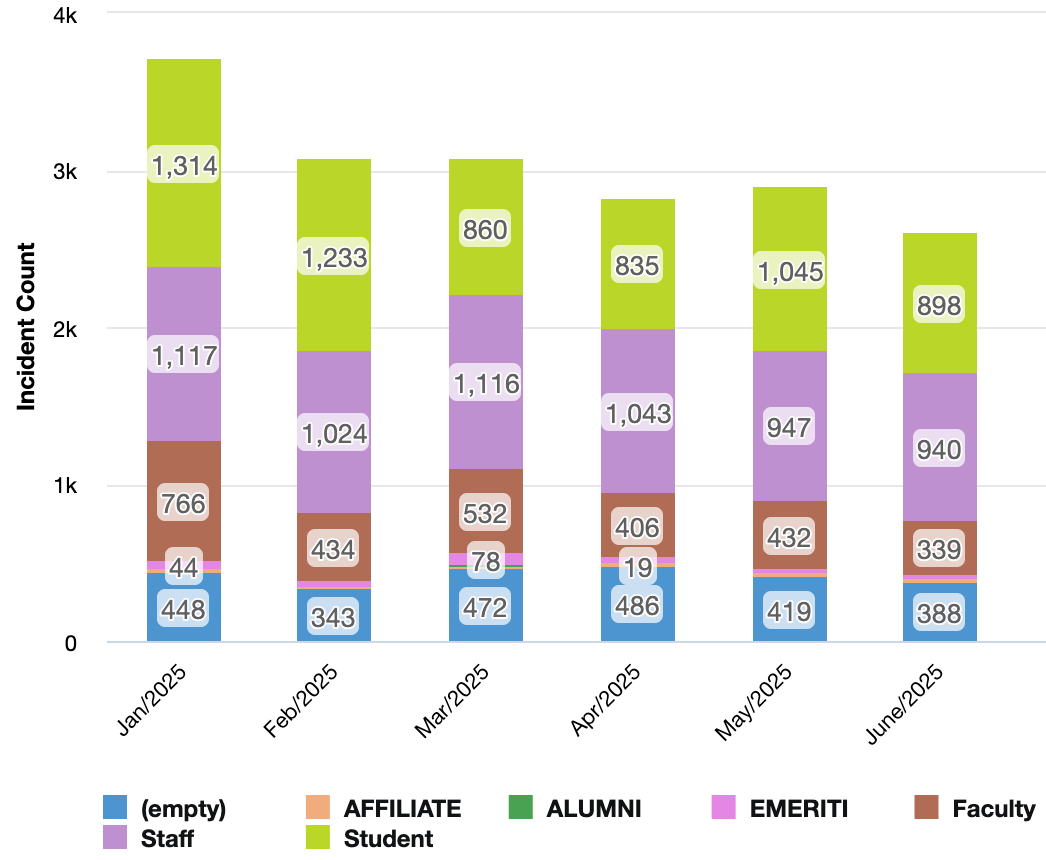
Number of incidents by user classification metric for January through June 2025
About this metric
This metric measures incidents per month as reported by different campus community audiences including students, staff, and faculty.
January 2025
- Student incidents: 1,314
- Staff incidents: 1,117
- Faculty incidents: 766
- Other: 492
February 2025
- Student incidents: 1,233
- Staff incidents: 1,024
- Faculty incidents: 434
- Other: 343
March 2025
- Student incidents: 860
- Staff incidents: 1,116
- Faculty incidents: 532
- Other: 550
April 2025
- Student incidents: 835
- Staff incidents: 1,043
- Faculty incidents: 406
- Other: 505
May 2025
- Student incidents: 1,045
- Staff incidents: 947
- Faculty incidents: 432
- Other: 419
June 2025
- Student incidents: 898
- Staff incidents: 940
- Faculty incidents: 339
- Other: 388