Customer satisfaction metric for January through June 2025
About this metric
Customer Satisfaction measures the degree to which a customer is happy with a service or support experience. Customers respond to a brief survey asking to rate their experience on a scale between 1 and 5 (with 5 representing “Very Satisfied” and 1 representing “Very Dissatisfied”) for the following categories:
- Courtesy of the analyst
- Analyst technical skills/knowledge
- Timeliness of service
- Quality of service provided
- Overall service experience
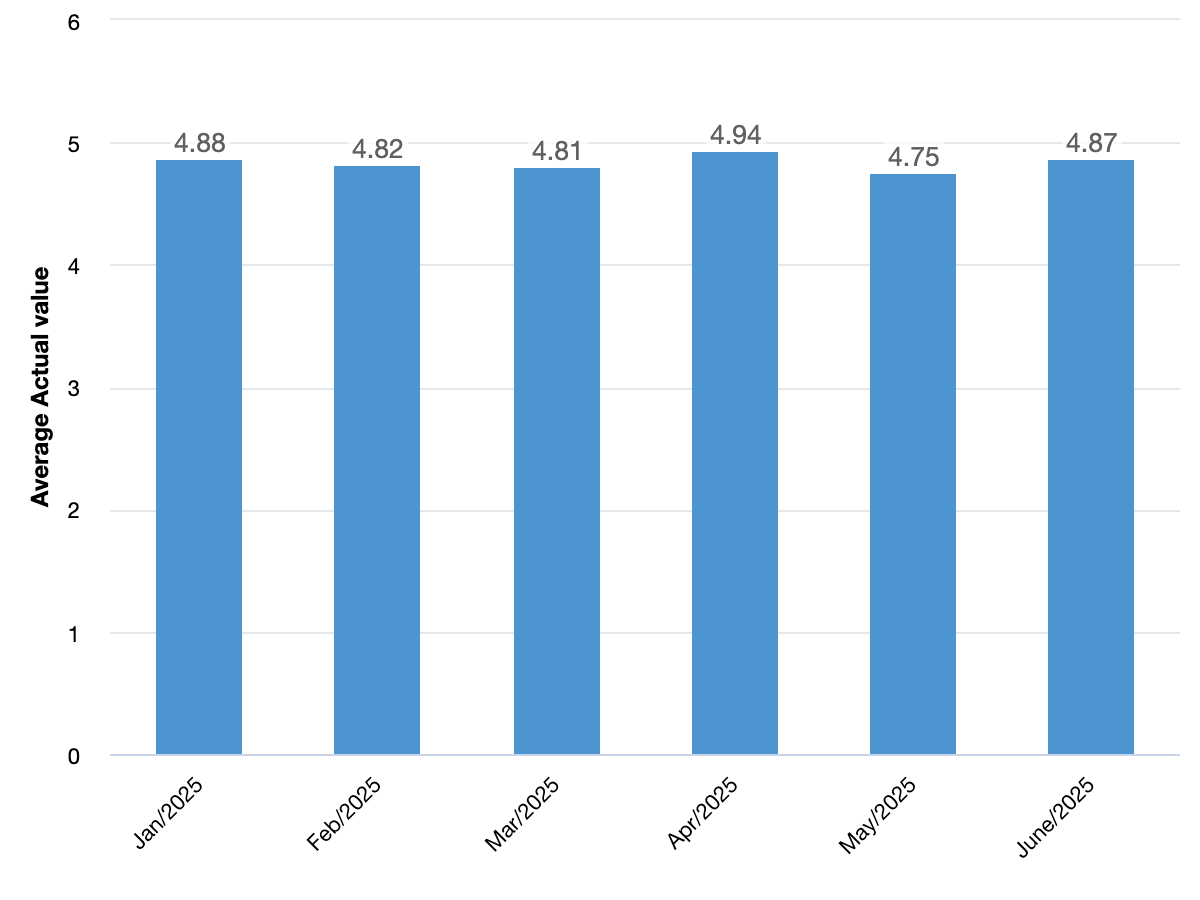
OIT’s goal is to attain an overall Customer Satisfaction score of 4.75 or better (meaning that 95% of our campus community gives us a score of 5).
January 2025
- Average actual value: 4.88
February 2025
- Average actual value: 4.82
March 2025
- Average actual value: 4.81
April 2025
- Average actual value: 4.94
May 2025
- Average actual value: 4.75
June 2025
- Average actual value: 4.87