The information below serves as a basic guideline. However, your instructor may have additional or different formatting requirements to add to or replace these. For more information see APA Publication Manual Seventh Edition.
Core sections of a report include:
- Title page: The title page often includes a descriptive title (not just “Report”), author’s name, class and section numbers, and date of submission. Check with the instructor for particular format or information required.
- Table of Contents
- List of Illustrations
- Executive Summary
- Introduction
- Body (e.g., method, findings, research, results)
- Conclusions
- References: This list includes only the sources cited in the text. If you want to include other, non-cited sources, then call this section Bibliography.
- Appendices
On shorter reports–under five pages–the Table of Content, List of Illustrations, and Executive Summary parts might not be required.
Additional Report Guidelines
Major Formatting Elements
Font
Most Common font used is Times New Roman 12-point font
Line Spacing
Most common line spacing used is Double-space text. An alternative is Single-space text.
Margins
Most common is one-inch margins all around. Use your word-processing software to add a header that will appear at the top of every page that includes the running head and the page number. The header appears within the top margin, not below it.
An alternative (if the report is to be enclosed in a binder) is to increase the left side margin to 1½ or 2 inches so that the tight binding will not make it difficult to read.
For more information see APA Publication Manual, sixth edition, section 8.03, pp. 229–230
Paragraph Format
Most Common is to Indent paragraphs one-half inch. An alternative is to insert a blank line between paragraphs, and then do not indent the paragraphs.
Page Numbers
- APA Style: Use Arabic numerals in the upper right hand corner with a running head. The running head is a shortened title no more than 50 characters, including spaces. It is flush with the left margin.
- Common Use: Arabic numerals, starting with the first page, centering the number in the page footer, about one- half inch from the bottom of the page
- Alternative: Number the prefatory pages (Table of contents, Preface, etc.) with lower case Roman numerals centered in the page footer about one-half inch from the bottom of the page.
Headings
Section Headings
Most Common is to use section headings with appropriate heading levels. A typical section will be from one to three or four paragraphs in length. Thus, on a double-spaced manuscript, one or two section headings will appear on each page. Headings must be consistent in format and parallel in grammatical structure.
Title Page
The title page includes five elements: title, running head, author, byline, institutional affiliation, and author note (which includes grant/funding information and a full correspondence address). The title page is numbered page 1.
Check with your instructor who may require other information on the title page.
The running head is a shortened title (no more than 50 characters, including spaces) that appears on every page. Use the automatic functions of your word-processing program to create a header that contains the running head and the page numbers for your paper. The header is located within, not below, the paper’s margin. There is no need to set the header at a specific distance from the top of the page. The words Running head: precede the running head on the title page only.
For more information see APA Publication Manual, sixth edition, section 2.01 – 2.03, section 8.03, pp. 229– 230, see also sample papers, pp. 41–59.
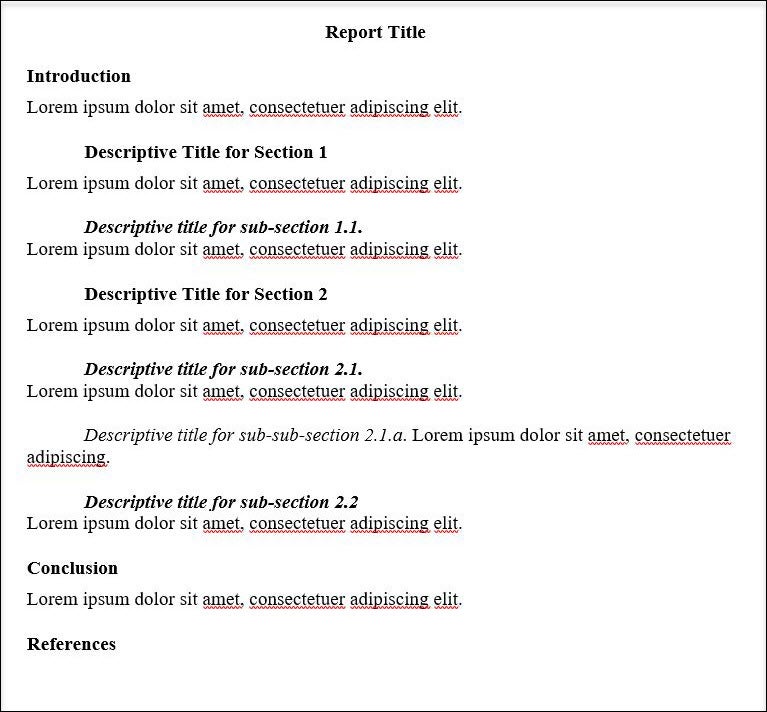
Sample Heading Formats
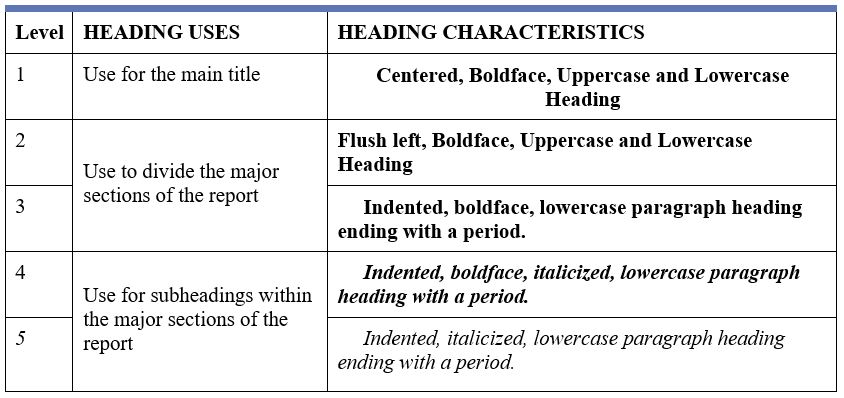
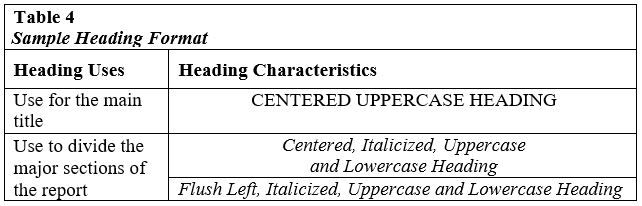
- Heading Level 1 is used for the main title. This should be a centered, boldfaced, uppercase and lowercase heading.
- Heading Level 2 is used to divide major sections of the report. This should be a flush left, boldface, uppercase and lowercase heading.
- Heading Level 3 is used to divide major sections of the report. This should be an indented, boldface, lowercase paragraph heading ending with a period.
- Heading Level 4 is used for subheadings within the major sections of the report. This should be an indented, boldface, italicized, lowercase paragraph heading with a period.
- Heading Level 5 is used for subheadings within the major sections of the report. This should be an indented, italicized, lowercase paragraph heading with a period.
Heading Tips
- Proceed through the levels numerically, starting with Level 1, without skipping over levels.
- The first heading won’t be called “Introduction” or be the title of your paper. The first heading will likely be somewhere in the body of your paper.
- Use as many levels as necessary to convey your meaning. Many student papers and published articles utilize two or three levels. Longer works like dissertations may demand four or five.
- For level 1 and 2 headings, capitalize the first and last words and all “major” words (nouns, verbs, adjectives, adverbs, and pronouns), including the second part of hyphenated major words (e.g., Self-Report not Self-report); and all words of four letters or more. ); lowercase all articles (a, the), prepositions (to, at, in, with), and coordinating conjunctions (and, but, or).
Report Style
Reports generally employ a more formal, professional style than do many letters, memos, or e- mails. The formal, professional style adds power to the report by emphasizing analysis and facts.
To accomplish a formal, professional style:
- Avoid informal words and phrases. Such words and phrases include jargon, colloquial expressions, contractions, slang, and casual language.
- Active Voice-when the subject of the sentence the person or thing doing the action of the verb or in the state expressed by the verb. This is the voice with which we are most familiar-the subject performs the action of the sentence. Explain abbreviations and acronyms at their first appearance.
- Avoid using personal pronouns, especially first person pronouns (I, me, we, our) and second person pronouns (you).
- Minimize use of adverbs and adjectives.
Formal vs. Informal Styles
Consider the two comparative samples of the formal, professional and informal styles.
Sample 1
- Formal: This report will detail the advantages the company will see from the implementation of certain management reforms. These reforms will not adversely affect current policies and procedures.
- Informal: In this report, I’ll explain the significant advantages that we can accomplish by ramping up a couple of management reforms. These reforms won’t require us to make major changes in the way we currently operate.
Sample 2
- Formal: The authors of this report suggest that the firm narrow its marketing focus.
- Informal: We think that you shouldn’t have your marketing program be all over the board.
The Executive Summary
Executive Summary vs. Abstracts vs. Introductions
Most professional business reports use an executive summary rather than an abstract or introduction. The executive summary has the advantage that it can be skimmed very quickly by a busy manager to get the critical information.
The differences between an executive summary, an abstract, and an introduction can be described as follows:
- An executive summary is a brief overview of a report designed to give readers a quick restatement of the report’s main points. The reader or audience is usually someone who makes funding, personnel, or policy decisions and needs information quickly and efficiently. The purpose of the executive summary is to consolidate the principal points of a document in one place. The summary should help the audience understand the main points, the evidence for those points, and why those points matter, without having to read the entire report.
- An abstract is a brief, comprehensive summary of the contents of an article; it allows readers to survey the contents of an article quickly. It is typically a highly condensed overview of 250 words or less.
- Introductions differ from executive summaries in that they present the specific problem under study and essential background information needed to better understand the detailed information to follow. They announce the purpose, why the topic is important, scope of coverage, and methodology used. However, an introduction usually does not say what the actual conclusions are or what evidence is used to reach those conclusions.
Guidelines for Writing Executive Summaries
An effective executive summary will be able to stand alone, because decisions may be made based upon the strength of the executive summary alone. The best strategy for writing the executive summary is to organize it according to the sequence of information presented in the full report.
Other things to consider include:
- Do not introduce new information that is not in the report.
- Write the executive summary last, after you have completed the report and decided on your recommendations.
- Make the length of the summary proportional to the full report it summarizes, typically 10-15 percent. Most executive summaries are one to two pages.
- Write the summary at the lowest level of technicality, translating specialized terms and complex data into plain English.
- Avoid personal comments such as “this report was very interesting” or “the author seems to think that….
- Organize the summary according to the sequence of information presented in the full report.
- End the summary with a one- or two-line recommendation for action along with the justification for the proposed action using terms the audience will consider important.
Look at first and last sentences of paragraphs to begin to outline your summary. Find key words and use those words to organize a draft of your summary; look for words that enumerate (first, next, finally); words that express causation (therefore, consequently); words that signal essentials (basically, central, leading, principal, major) and contrast (however, similarly, more than, less likely).
Sample Executive Summary
The following example of an executive summary is from the Colorado State University online Writing Studio:
EXECUTIVE SUMMARY
Susie’s Cookies began as a small business in Cleveland, Ohio, which has expanded to include 45 stores throughout the Midwest. Plans have already been instituted to expand sales nationwide, using the same “mall-concept” marketing strategy, which has proven successful in the Midwest. Despite these plans, Susie’s Cookies may be in danger of bankruptcy.
Advertising Costs
Susie’s quadrupled its sales in the last two quarters, realizing a profit of $750,000 in the current year, an increase of $250,000 over the previous year, due to its increase in advertising. To realize equivalent sale figures nationwide, however, it is projected that advertising costs will increase by 200% for the first two years of the national expansions.
Expansion Costs
Further, construction costs for the new stores are estimated to be 20 million dollars. The result of increased advertising and construction costs will put a substantial debt burden on Susie’s cookies, an estimated $750,000 to 1 million a year. Given that sales did not reach current levels in the Midwest until the 45 stores had been operating for five years, projected sales nationally will not cover expansion costs. As a result, Susie’s Cookies is likely to show a loss of almost $2 million for at least the next five years.
Recommendation
Due to the high advertisement and development costs of national expansion, Susie’s Cookies may not be able to continue doing business in the future. Therefore, we recommend that Mrs. Field’s does not participate in the hostile takeover under consideration because the threat of competition will not be realized.
Tables
Tables
A report can be enhanced significantly by the use of appropriate tables and figures. Use them to summarize group data or information that is further discussed in the paragraphs immediately before and after.
Tables show data in rows and columns. Figures include graphs, charts, drawings, pictures and illustrations. Tables and figures are used to make it easier to interpret the information contained in them.
Some general rules for all tables, figures and equations:
- Identify each element of the figure or table and make sure the units of measurement are identified (e.g., dollars, euros, units, pounds, percentages, etc.).
- When the data or information is taken from other sources, you MUST include an appropriate citation.
- Try not to split tables and figures across pages.
- Add notes below the table or figure to explain the contents. Any symbol, acronym or abbreviation should be defined if not widely used; general notes or footnotes in a table or figure are labeled “a,” b,” and “c.”
The table or figure should be closely integrated into the text or body of the report
Here are some things to remember to make that integration clear for the reader:
- Always mention and discuss the table or figure in the text.
- Place the table or figure close to where it is first mentioned in the text, or on separate pages at the end of the document if they are extensive.
- Capitalize the word Table 1 or Figure 1 in the text when referring to it. Refrain from using “the table below,” or “the table on page 17.”
- Use the same font as used in the paper.
Keep your tables as simple as possible
- Highlight key information and eliminate the rest. For example, if annual sales volume is the key point, do not provide monthly sales information in the table.
- Drop cents from dollar figures: “$3,000” versus “$3,000.00”.
- Keep all comparable tables in the document consistent in presentation.
- Make sure each row or column in the table has a heading.
- Number each table sequentially throughout the document.
- Add a brief explanatory title underneath or to the right of the table number.
Tables Containing Numbers or Statistics
- Do not change the number of significant digits or units of measurement within a column.
- If a number is less than 1, place a 0 before the decimal unless the number cannot be greater than 1.
- Single-space text or numbers within a table, regardless of whether the report overall is single- or double-spaced. (Follow your instructor’s directions.)
- Identify all probability level values with asterisks attached to the appropriate table entries. Use the same number of asterisks for a given probability level in all tables in the same report. Generally, the largest probability receives the fewest asterisks.
- Put the notes in the following order: general note, specific note, and probability note.
(APA Publication Manual sixth edition, sections 5.07–5.19, pp. 128–150; Table 5.1, p. 129, illustrates the basic components of a table; section 8.03, p. 228)
Tables 1 – 3 offer examples of numerical tables
Table 1 – Prototypical Table
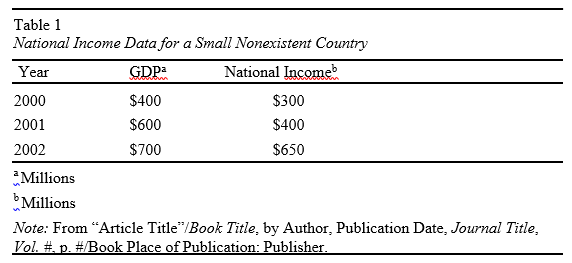
Table 2
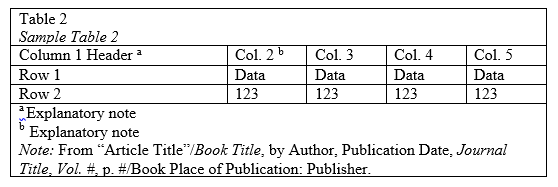
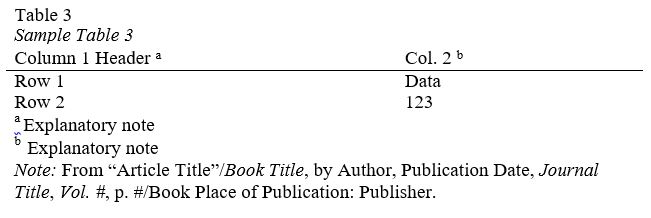
Table 3
Word Tables
Many tables simply contain text. There are few formatting rule for these. The main thing is for the table to be clear and easily understood. The basic rules about tables still apply, such as keeping a consistent font, sequentially numbering the tables, providing a descriptive title, and referring to the table in the text of the report. Table 4 offers an example of a word table.
Example Table 4
Figures
Figures include graphs, charts, maps, drawings, illustrations, or photographs
A good figure can greatly improve the reader’s understanding of a concept. Make sure that your figures:
- convey essential facts;
- omit details that are not relevant to the point you are making;
- are easy to read and understand; their purpose is apparent;
- are prepared in the same style as similar figures in the same article; that is, the lettering is of the same size and typeface, lines are of the same weight and so forth;
- are sequentially numbered with an explanatory title placed consistently either above or below the figure; and
- have clearly labeled elements, axes and elements.
(APA Publication Manual, sixth edition, sections 5.20–5.30, pp. 150–167; section 8.03, p. 230) Figures 1, 2, 3, and 4 provide examples of how to format different types of figures.
Examples of Figures
Figure 1. Least Cost Solution for Cobb Douglas Production Function.
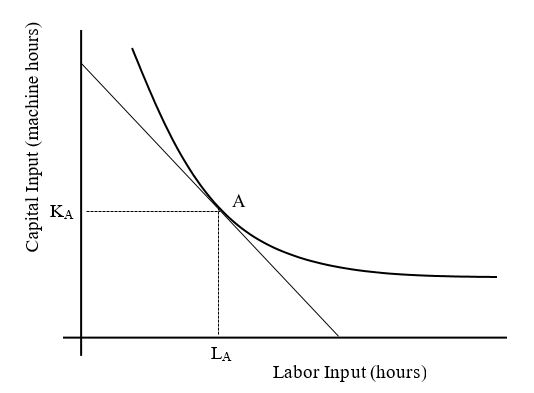
Note: From “Article Title”/Book Title, by Author, Publication Date, Journal Title, Vol. #, p. #/Book Place of Publication: Publisher.
Figure 2. Quarterly Report for East, West, and North Regions
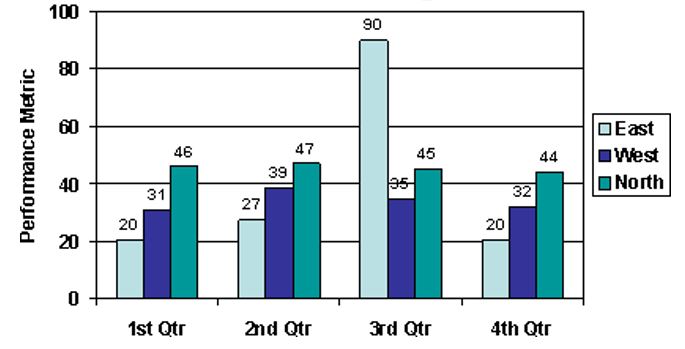
Note: From “Article Title”/Book Title, by Author, Publication Date, Journal Title, Vol. #, p. #/Book Place of Publication: Publisher.
Figure 3. Boise State University Logo

Equations
Place short, simple equations in the line of text
- To display an equation, place it on a separate line, indented, with extra space above and below. If the equation does not fit on a single line, separate it before an operational or relational symbol. There is no need to use punctuation at the end of an equation.
- Insert a space on either side of the operators +, -, = except in subscripts or superscripts.
- When referring to numbers equations, write out the reference; for example, write Equation 1 (do not abbreviate), or write the third equation.
- Number all equations sequentially, (1), (2), etc., and enclosed in parentheses. The number should be placed on the same line as the equation near the right margin of the page.
For more information on equations see APA Publication Manual, sixth edition, sections 4.47- 4.49.