Boise State received CAEP accreditation as an early adopter for a seven-year term from October 2016 to December 2023. This accreditation is granted for initial preparation programs. In 2023, Boise State will be reviewed for both initial and advanced programs aligned with CAEP standards.
Click here to read more about Boise State’s accreditation status on the CAEP website.
CAEP Annual Reporting Measures: Information and Supporting Evidence
The tables appearing on this page include data and analyses for the eight CAEP annual reporting measures. These measures support all parts of Boise State’s accreditation process for educator preparation programs, but in particular standard component 5.4 for initial and advanced programs, standard components 4.1-4.4 for initial programs, and standard components 4.1 and 4.2 for advanced programs.
Annual Reporting Measures (CAEP Component 5.4 | A5.4)
Annual reports are available in .pdf versions going back to 2011.
CAEP Annual Reports (all years) from AIMS, Boise State University
Note: there was no annual report submitted for 2013. We strive to ensure all our content is accessible. If you need the annual reports in another format to fully access the information, please contact Katie Mathias at katiemathias@boisestate.edu.For additional questions about Boise State Educator Preparation Programs accreditation and annual reporting processes, please contact Dr. Carrie Semmelroth, Director for Assessment and Communications, (208) 426-2818, carriesemmelroth@boisestate.edu.
Impact Measures (CAEP Standard 4)
Boise State has studied the impact of initial program completers through case studies focused on “Studying Practice and Student Learning” (SPSL). During 2014-2015, the unit focused on elementary teachers in grades K-6. In 2015-2016, the next iteration of SPSL included K-12 teachers from a variety of content areas and endorsement programs. This continued inquiry brought together EPP faculty and 19 completers in a community of practice to support the development, teaching, and critical analysis of a classroom unit of study.
During 2016-2017, Boise State EPP work focused on program improvement efforts focused on evidence from the completer case studies. Faculty also shared results with state and national audiences and initiated an innovative partnership among EPPs across the state. As a state coalition, Idaho Coalition for Educator Preparation (ICEP) applied for and received a $263,384 grant from the Idaho State Board of Education in connection with Eligible Partnership Subgrants for Title II Part A Subpart 3 in the No Child Left Behind Act of 2001. Funding supported a pilot of Boise State’s completer study, Studying Practice and Student Learning, at the state level as a form of new teacher induction for 2017-2018. Data from three regions in Idaho (southwest, central and southeast) will be reported to the State Board of Education at the end of the funding cycle. Results from this study will also be shared on this website at that time (late summer 2018).
Preliminary analyses from the SAHE grant indicate Boise State completers continue to grow and develop. For example, observation data indicate that new teachers are well-started beginners who continue to add to their strengths and skills over time. Also, the preliminary student learning outcome data shows most completers were able to design and implement instruction in a unit of study that had an impact level of “effective” or “highly effective”.
1. Impact on P-12 Learning and Development
In 2015-2016, initial certification completers engaged in a directed unit study called the Studying Practice and Student Learning (SPSL), which is similar to their preservice performance assessment. Completers planned and enacted a unit of study, analyzed formative and summative student data and student-learning outcomes (SLOs), and reflected and responded to their student data.
From the case study, student learning outcomes (SLOs) demonstrated teachers’ ability to deliver instruction that impacted the learning of their students. Analysis at the whole class level found 75% of SPSL units were rated highly effective or effective for the percentage of students meeting target criteria.
Impact on Student Learning at the Whole Class Level, 2015-2016
This table includes the effectiveness ratings for the whole class student learning outcomes for the percentage of students who met target criteria.Impact on Student Learning at the Individual Level, 2015-2016
This table includes the effectiveness ratings for the learning outcomes of students who received individualized differentiated instruction by our completers. The students who received this instruction were selected for differentiation by the completers based on observations, formative assessments, benchmark data, etc.2. Indicators of Teaching Effectiveness
Aligned with Danielson’s Framework For Teaching (FFT), initial certification completers were observed for teacher effectiveness. Three classroom observations per completer were conducted by certified FFT observers, using the Framework for Teaching observable components on domains 2 and 3. Additional data sources included the Preservice Professional Year Assessment (PYA) and inservice principal evaluations. Observations were scored on the FFT rubric: Unsatisfactory (1), Basic (2), Proficient (3), and Distinguished (4).
Observation scores overall represent a rating of Proficient (3.0) or above. Particular areas of strength for the completers were 2a. Developing Respect and Rapport (3.2) and 2b. Establishing a Culture for Learning (3.1). These findings are also triangulated with high scores on the Tripod Survey of Student Perceptions for the related construct of Care (4.5) and Challenge (4.3) (see: the next table). Comparisons with the scores from the PYA demonstrate continued growth on the components of the FFT over time and principal evaluations were in agreement with university observers.
Observation Data on the Danielson Framework for Teaching Observable Components, 2015-2016
The Tripod Survey of Student Perceptions (Ferguson, 2012) was administered as an additional measure of teacher effectiveness. Students in K-12 classrooms complete a survey of their perceptions of their teachers on seven metrics. The tripod survey was used in the Measures of Effective Teaching (MET) study of Teacher Quality (2012) and had the highest correlation with student achievement of any of the measures tested (Ferguson, 2012). The survey measures seven components (scales): Care (7 items), Control (4 items), Clarify (8 items), Challenge (4 items), Captivate (4 items), Confer (7 items), and Consolidate (2 items). A score of 5 indicates a high level of agreement with the items on the scale.
Tripod Survey of Student Perceptions, 2015-2016
Results from the tripod surveys found completers were well respected by their students across the seven components. On calculated means, all completer scores were between 3.29 and 4.47 on a 5-point scale. When comparisons were made between study teachers’ percent agreement and teachers from the MET Study (2010), whose student learning outcomes ranked in the 75th percentile, completers’ percent agreement matched or exceeded the MET study teachers in all constructs except Control.
Boise State Completer Tripod Survey of Student Perceptions Results Compared Against the MET Study Findings, 2015-2016
*Results reported by mean for each construct on a 5-point scaleEmployer and Alumni Surveys
In 2014-2015, the Idaho Coalition for Educator Preparation (ICEP) group developed and validated an alumni and employer survey to inform the continuous improvement of Idaho EPPs. The surveys were developed for alumni who have graduated within the past three years from Idaho’s EPPs to measure how prepared they feel for teaching in a classroom, and to measure employer satisfaction of these programs. The surveys are aligned with the Danielson Framework for Teaching (FFT) evaluative rubric (Unsatisfactory, Basic, Proficient, and Distinguished) to maintain consistency across EPPs and evaluation items. The question items are aligned with InTASC standards. The alumni and employer surveys were validated through ICEP in the summer 2015 and distributed that fall across the state of Idaho to inform all EPPs.
Previous results from the alumni and employer surveys are available for initial programs.
Click here to review previous results from the alumni and employer surveys for initial programs.
In 2017-2018, Boise State piloted both the alumni and employer surveys at the initial and advanced program levels. The use of the same survey across the EPP unit allows for analysis of trends and patterns across levels and programs. With future administrations of this survey, collected data will allow for analysis of patterns and trends over time.
Results from these surveys are reported by the mean and median at the unit, initial and advanced programs levels.
3. Satisfaction of Employers
Through surveying the employers of our graduates across initial and advanced programs, Boise State intends to measure the degree to which employers are satisfied with completer preparation for assigned responsibilities in working with P-12 students (CAEP standards 4.3 and A.4.1).
The results from this pilot use of the employer survey at the unit level has provided two important findings for next steps. First, the lower reported mean scores for strategies to support new English language learners is consistent with scores found in the alumni surveys on similar items. This an area identified by the unit for program improvement which reinforces the importance of the ongoing work in this area. Second, the lower response rate (n=57) provides program coordinators with specific next steps for the next survey administration. The trends and patterns from these results will help inform any program changes as the unit heads into 2018-2019.
2017 Employer Survey of completers from 2014-2015 and 2015-2016
4. Satisfaction of Completers
Results from the 2017-2018 pilot alumni survey support findings from the employer survey (as well from other assessments in the unit) that supporting new English language learners is an area of improvement for our EPPs. Overall, the scores reveal alumni evaluate our programs to be proficient and above in preparation.
2017 Alumni Survey of completers from 2014-2015, 2015-2016 and 2016-2017
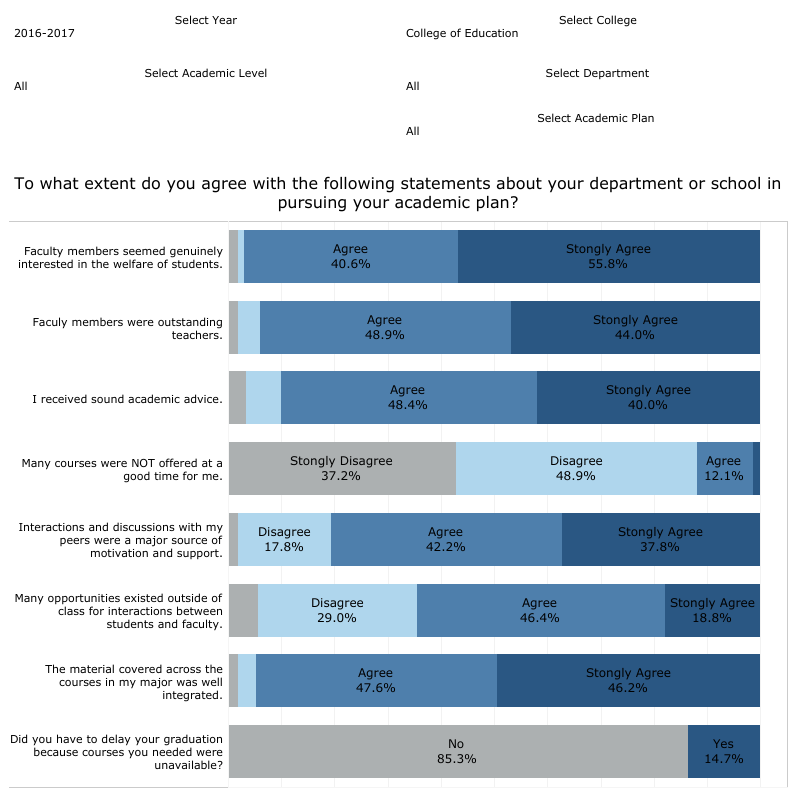
In addition to the Alumni Survey administered through the EPP, Boise State’s Office of Institutional Effectiveness administers a Graduating Student Survey to all undergraduate and graduate students graduating in a given academic year. The Graduating Student Survey was revised significantly for the 2015-2016 and later administrations. Results from 2015-2016 and 2016-2017 can be accessed via an interactive dashboard on the Office of Institutional Effectiveness’s website. The results can be disaggregated by college, department, programs, etc. Overall results from this university level survey indicates satisfaction from completers. Additional analyses of these data will be completed in 2018-2019 with the results from the pilot use of the alumni and employer surveys at the unit level. The data from this university level survey will provide an additional measurement to help inform program improvement.
Access the 2016-2017 results for the College of Education from the Graduating Student Survey. Additional analyses by program can be viewed on the dashboard.
Outcome Measures
5. Graduation Rates
Boise State’s Office of Institutional Effectiveness regularly completes research and analyses on a variety of topics related to student success and other other university performance metrics. Data from these reports can be used to answer multiple questions related to graduation and retention rates.
The EPP quality assurance system at Boise State continues to improve and develop to inform programs with data and evidence. As the quality assurance system becomes more centralized and supported, both cohorted and non-cohorted programs will be better able to track candidates for retention and graduation rates.
6. Licensing and State Requirements
The table below includes pass rates for initial certification completers reported on Title II.
For more information, visit the Title II website.
Title II Summary Pass Rates for Initial Certification
Additional information about certification rates can be found in the measure below for placement rates.
7. Placement Rates: Initial Certification
The placement analyses in the table below feature the count and percentage of initial certification completers who did and did not choose to go into teaching.
Initial Placement Rates by Totals
The “grand total of completers” is the number of students who completed a teacher preparation program for initial certification.The “count of completers who chose to certify after program completion” is the number of completers, and the “certification rate (count of completers who chose to certify/grand total)” is the percentage of completers who submitted an application for institutional recommendation to the associate dean for teacher education. Once the institutional recommendation for certification is signed by the associate dean, the completer’s application is forwarded to the Idaho State Department of Education for teacher licensure. These report the number of completers who applied for certification. It does not differentiate who went on to accept teaching positions.
The “placement rate excluding those choosing not to certify from grand total (placement count/grand total-not certified)” is the percentage of certified completers who were verified to be in teaching positions in the following year of completion (e.g., a 2017-2018 completer who can be verified in a teaching position in 2018-2019).
Note: The “placement rate” is calculated simply by dividing the number of completers who are teaching by the number of completers who completed certification. Some completers who certified went on as graduate students, chose not to work in education, or it was not possible to locate any information; these are still included in the denominator of the placement rate calculation.
Of those completers who chose to go into teaching, the placement analyses in the table below includes the count and percentage of completers who are teaching in and out of Idaho.
Rates of Placement Areas
Percentage (and counts) of placement areas for completers who accepted teaching positions in Idaho, out of Idaho, and out of the United States.Of those completers who chose to go into teaching, the placement analyses in the table below includes the count and percentage of completers who are teaching in Idaho.
Click here to see a list of all six Idaho regions.
Rates of Placement in Idaho
Percentage (and counts) of placement areas for completers who accepted teaching positions in Idaho.Of those completers who chose to go into teaching, the placement analyses in the table below includes the count and percentage of completers who are teaching in Idaho’s Region 3.
Click here to see a list of all six Idaho regions.
Rates of Placement in Idaho’s Region 3
Rates (and counts) of placement areas for completers who accepted teaching positions in Idaho’s Region 3.8. Consumer Information: Boise State Educator Preparation Programs that Lead to Licensure
Boise State Educator Preparation Programs that Lead to Licensure
*Programs align with the 2024-2025 undergraduate and graduate catalog listings.8. Consumer Information: Student Loan Default Rates
Three-Year Student Loan Default Rate at Boise State and National Averages
Boise State’s Office of Financial Aid and Scholarships provides annual default rates for the university and national averages by request.For more information about these rates, please visit the Financial Aid and Scholarships website: https://financialaid.boisestate.edu/
8. Consumer Information: Starting Teacher Salaries in Idaho
Average Teaching Salary in Idaho, and Starting Teacher Salaries in School Districts near Boise State
Note 1: The first row, “Idaho Average Teaching Salary”, is an average of ALL teaching salaries in Idaho (across pay scales and districts). The rest of the rows list STARTING teacher salaries for districts near Boise State.Note 2: To the greatest extent possible, teacher salaries are linked to district salary schedules listed online. If you need a PDF document in a different version to be fully accessible, please contact the associated school district for assistance.
8. Consumer Information: Idaho Certification Lookup
The Idaho State Department of Education, Certifications and Professional Standards provides a certification lookup application tool on its website. This application allows for searches for educators who currently hold or have help Idaho certification.
Click here to visit the Idaho Certification Lookup Application website tool.
8. Consumer Information: NASDTEC Interstate Agreement
The National Association of State Directors of Teacher Education and Certification (NASDTEC) interstate agreement is a collection of over 50 individual agreements by states and Canadian provinces that defines which other states’ educator certificates will be accepted by that state.
Click here to visit the NASDTEC interstate agreement website.
8. Consumer Information: What can I do with my certification?
Idaho State Department of Education has created the Idaho System for Educational Excellence (ISEE), a K-12 Longitudinal Data System that helps to deliver information to stakeholders involved in education.
ISEE provides an assignment credential manual that crosswalks types of certification with specific types of education employment opportunities.
Click here to visit the ISEE website.
Click here to reference the 2017-2018 SDE Assignment Credential Manual.
References:
Bill and Melinda GATES Foundation (2010, December). Learning about Teaching: Initial findings from the measures of effective teaching. Retrieved June 2014 from metproject.org: metproject.org/downloads/preliminary_findings_policy_brief.pdf
Bill and Melinda GATES Foundation (2012). MET Project. Retrieved June 2015 from metproject.org: metproject.org.download/Asking_Students_Practioner_Brief.pdf
CCSSO’s Interstate Teacher Assessment and Support Consortium (2013). InTASC: Model Core Teaching Standards and Learning Progressions for Teachers 1.0. (C. o. Officers, Ed.) Washington DC.
Danielson, C. (2013). Enhancing Professional Practice: A Framework for Teaching (2nd ed.). Alexandria, VA: ASCD.
Ferguson, R. (2012). Can student surveys measure teaching quality? Teacher Evaluation, 94 (24).