Boise State received CAEP accreditation as an early adopter for a seven-year term from October 2016 to December 2023. This accreditation is granted for initial preparation programs. In 2023, Boise State will be reviewed for both initial and advanced programs aligned with CAEP standards.
Click here to read more about Boise State’s accreditation status on the CAEP website.
CAEP Annual Reporting Measures: Information and Supporting Evidence
The tables appearing on this page include data and analyses for the eight CAEP annual reporting measures. These measures support all parts of Boise State’s accreditation process for educator preparation programs, but in particular standard component 5.4 for initial and advanced programs, standard components 4.1-4.4 for initial programs, and standard components 4.1 and 4.2 for advanced programs.
Annual Reporting Measures (CAEP Component 5.4 | A5.4)
Annual reports are available in .pdf versions going back to 2011.
CAEP Annual Reports (all years) from AIMS, Boise State University
Note: there was no annual report submitted for 2013. We strive to ensure all our content is accessible. If you need the annual reports in another format to fully access the information, please contact Katie Mathias at katiemathias@boisestate.edu.For additional questions about Boise State Educator Preparation Programs accreditation and annual reporting processes, please contact Dr. Carrie Semmelroth, Director for Assessment and Communications, (208) 426-2818, carriesemmelroth@boisestate.edu.
Impact Measures (CAEP Standard 4)
Boise State continued its Completer Case Study, Studying Practice and Student Learning, work in connection to a teacher induction project for 2017-2018. A State Agency Higher Education (SAHE) Partnership Grant (Idaho State Board of Education in connection with Eligible Partnership Subgrants for Title II Part A Subpart 3 in the No Child Left Behind Act of 2001) supported this statewide induction project modeled after prior Boise State completer case studies. The 2017-2018 statewide project also allowed for disaggregated data so each EPP could identify outcomes for its individual program completers across the state.
Analyses from the SAHE grant indicate that like other completers in Idaho, Boise State completers continue to grow and develop after graduating from our programs. For example, observation data indicate that new teachers are well-started beginners who continue to add to their strengths and skills over time. Also, student learning outcome data show most completers were able to design and implement instruction in a unit of study that had an impact level of “effective” or “highly effective”.
1. Impact on P-12 Learning and Development (Component 4.1)
Disaggregated data from the 2017-2018 induction project were analyzed at the EPP level for completer performance analysis. As in the 2015-2016 completer study, results indicate that Boise State completers continue to perform at proficient levels on multiple indicators of teacher effectiveness measures and are ‘well-started’ beginners.
In 2015-2016, initial certification completers engaged in a directed unit study called Studying Practice and Student Learning (SPSL), which is similar to their preservice performance assessment. Completers planned and enacted a unit of study, analyzed formative and summative student data and student-learning outcomes (SLOs), and reflected and responded to their student data. This measure was repeated in 2017-2018.
Student learning outcomes (SLOs) demonstrated teachers’ ability to deliver instruction that impacted the learning of their students. Analysis at the whole class level found 77% of SPSL units were rated highly effective or effective for the percentage of students meeting target criteria. This is consistent with the results from 2015-2016.
Impact on Student Learning at the Whole Class Level, 2017-2018
This table includes the effectiveness ratings for the whole class student learning outcomes for the percentage of students who met target criteria from the 2017-2018 completer study.Completer reflections and goal setting on SLOs were analyzed for themes, trends and patterns. A frequency count of focus group comments on SLO unit data found the most prevalent theme centered around assessment literacy (44% of all comments). Within that context, completers revealed they would like additional support and development in the area of assessment construction (especially around measurement validity), and effective use of formative assessment. This finding is currently being used to make revisions in assessment courses for pre-service teachers.
Impact on Student Learning at the Individual Level, 2017-2018
This table includes the effectiveness ratings for the learning outcomes of students who received individualized differentiated instruction by our completers in the 2017-2018 completer study. The students who received this instruction were selected for differentiation by the completers based on observations, formative assessments, benchmark data, etc.2. Indicators of Teaching Effectiveness (Component 4.2)
Aligned with Danielson’s Framework For Teaching (FFT), initial certification completers were observed for teacher effectiveness. Three classroom observations per completer were conducted by certified FFT observers, using the Framework for Teaching observable components on domains 2 and 3. Additional data sources included the Preservice Professional Year Assessment (PYA) and inservice principal evaluations. Observations were scored on the FFT rubric: Unsatisfactory (1), Basic (2), Proficient (3), and Distinguished (4).
Observation Data on the Danielson Framework for Teaching Observable Components, 2017-2018
The Tripod Survey of Student Perceptions (Ferguson, 2012) was administered as an additional measure of teacher effectiveness. Students in K-12 classrooms complete a survey of their perceptions of their teachers on seven metrics. The tripod survey was used in the Measures of Effective Teaching (MET) study of Teacher Quality (2012) and had the highest correlation with student achievement of any of the measures tested (Ferguson, 2012). The survey measures seven components (scales): Care (7 items), Control (4 items), Clarify (8 items), Challenge (4 items), Captivate (4 items), Confer (7 items), and Consolidate (2 items). A score of 5 indicates a high level of agreement with the items on the scale.
Tripod Survey of Student Perceptions, 2017-2018
When comparisons were made between study teachers’ percent agreement and teachers from the MET Study (2012), whose student learning outcomes ranked in the 75th percentile, completers’ percent agreement matched or exceeded the MET study teachers in all constructs except Control.
Boise State SAHE Tripod Survey of Student Perceptions Results Compared Against the MET Study Findings, 2017-2018
*Results reported by mean for each construct on a 5-point scaleEmployer and Alumni Surveys
In 2014-2015, the Idaho Coalition for Educator Preparation (ICEP) group developed and validated an alumni and employer survey to inform the continuous improvement of Idaho EPPs. The surveys were developed for alumni who have graduated within the past three years from Idaho’s EPPs to measure how prepared they feel for teaching in a classroom, and to measure employer satisfaction of these programs. The surveys are aligned with the Danielson Framework for Teaching (FFT) observation rubric (Unsatisfactory, Basic, Proficient, and Distinguished) to maintain consistency across EPPs and evaluation items. The question items are aligned with InTASC standards. The alumni and employer surveys were validated through ICEP in the summer 2015 and distributed that fall across the state of Idaho to inform all EPPs.
Previous results from the alumni and employer surveys are available for initial programs.
Click here to review previous results from the alumni and employer surveys for initial programs.
3. Satisfaction of Employers (Component 4.3 | A.4.1)
Through surveying the employers of our graduates across initial and advanced programs, Boise State intends to measure the degree to which employers are satisfied with completer preparation for assigned responsibilities in working with P-12 students (CAEP standards 4.3 and A.4.1).
Overall, the mean scores indicate employers evaluate our preparation programs to be proficient and above. Preparation for English language learners continues to be an area for improvement, scoring at 3.00 in 2017-2018 (surveying employers of our 2016-2017 completers). However this score has increased from 2.81 in 2016-2017 (surveying employers of our 2014-2015 and 2015-2016 completers). This increase may be a reflection of changes implemented in the unit after the 2016 accreditation review, and will be monitored in following years as a possible trend towards improvement.
2019 Employer Survey of Initial Completers from 2016-2017, n=62
The 16 questions from the employer survey are aligned with the four Interstate Teacher Assessment and Support Consortium (InTASC) areas: The Learner and Learning, Content and Pedagogical Knowledge, Instructional Practice and Professional Responsibility. This analysis provides a more aggregate view of the survey results, and allows for a simpler comparison across alumni and employer satisfaction. The InTASC results are also used on the ‘front-facing’ employer and alumni satisfaction web pages because the information is more accessible for a general audience.
2019 Employer Survey of Initial Completers from 2016-2017, InTASC Categories
This table reports the percentage of responses on the 2019 Employer survey grouped by InTASC categories.4. Satisfaction of Completers (Component 4.4 | A.4.2)
Results from the 2017-2018 pilot alumni survey support findings from the employer survey (as well from other assessments in the unit) that supporting new English language learners is an area of improvement for our EPPs. Overall, the scores reveal alumni evaluate our programs to be proficient and above in preparation.
Overall, the mean scores indicate alumni evaluate our preparation programs to be close to proficient or above. Consistent with previous years, alumni satisfaction survey scores are lower than employer satisfaction survey scores.
As with the employer survey, preparation for English language learners continues to be an area for improvement on the alumni survey, scoring at 2.43 in 2019 (surveying 2017-2018 alumni). This score is more or less similar to the 2018 result of 2.50 (surveying 2016-2017 alumni). The unit will maintain a close eye on this particular area for improvement as changes continue to be made in this important area of preparation.
2019 Alumni Survey of Initial Completers from 2017-2018, n=43
Mean scores by question.The 16 questions from the alumni survey are aligned with the four Interstate Teacher Assessment and Support Consortium (InTASC) areas: The Learner and Learning, Content and Pedagogical Knowledge, Instructional Practice and Professional Responsibility. This analysis provides a more aggregate view of the survey results, and allows for a simpler comparison across alumni and employer satisfaction. The distribution of scores are more spread/distributed across Basic, Proficient and Distinguished for the alumni survey than the employer.
2019 Alumni Survey of Initial Completers from 2017-2018, InTASC Categories
This table reports the percentage of responses on the 2019 Alumni survey grouped by InTASC categories.In addition to the Alumni Survey administered through the EPP, Boise State’s Office of Institutional Effectiveness administers a Graduating Student Survey (GSS) to all undergraduate and graduate students graduating in a given academic year. The Graduating Student Survey was revised significantly in 2015-2016 and later administrations reflect these changes. Results for 2017-2018 can be accessed via an interactive Tableau dashboard on the Office of Institutional Effectiveness’s website. The results can be disaggregated by college, department, programs, etc. Overall results from this university level survey indicate satisfaction from completers.
Click here for all GSS results and information through the Office of Institutional Effectiveness.
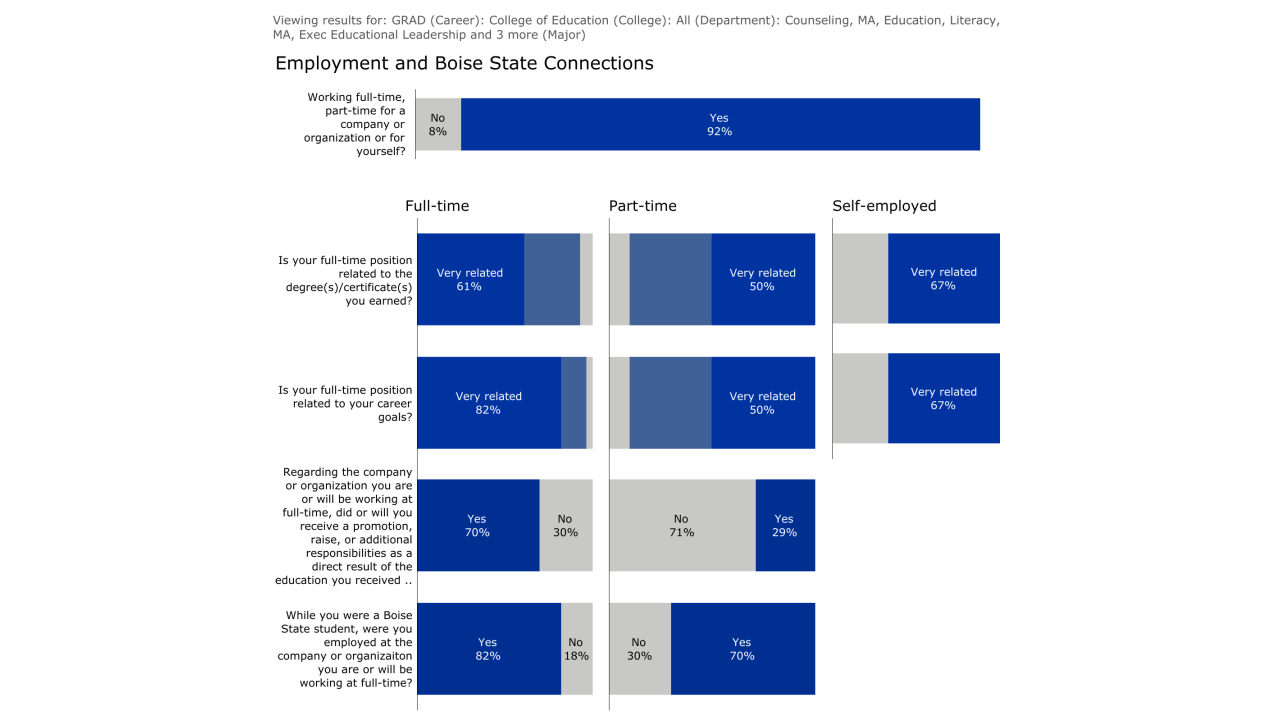
Results from the 2017-2018 GSS survey for all advanced programs leading to licensure indicate completer satisfaction and success. Selected measures are featured below, and all results can be found here, or in the table below.
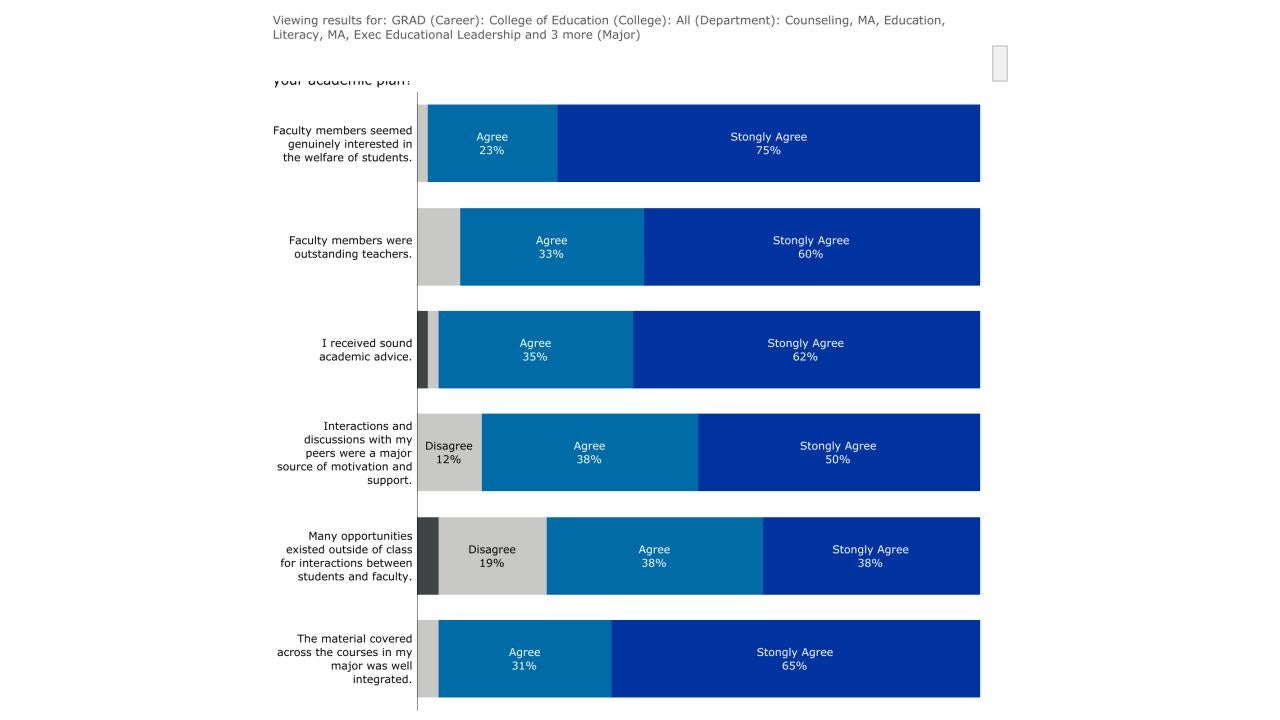
Measures related to department satisfaction indicate overall agreement among advanced completers that faculty provided support for learning.
Measures related to overall satisfaction about advanced programs indicate almost 100% agreement that completers would recommend others to the program and Boise State.

Measures related to employment outcomes indicate that most completers who work full-time expect to receive a promotion or advancement upon completion of their programs.
Additional results from the 2017-2018 GSS survey for each advanced program leading to licensure are available by each program in the table below.
2017-2018 Graduating Student Survey Results for Advanced Programs Leading to Licensure
Outcome Measures
5. Graduation Rates
Boise State’s Office of Institutional Effectiveness regularly completes research and analyses on a variety of topics related to student success and other other university performance metrics. Data from these reports can be used to answer multiple questions related to graduation and retention rates.
In 2017 Boise State’s first-year retention rate was at 80 percent, the highest ever. The university’s overall graduation rate also increased by 10 percent in a decade. This increase is part of the university’s ongoing efforts to increase degree completion. The EPP quality assurance system at Boise State continues to improve and develop to inform programs with data and evidence.
6. Licensing and State Requirements
The table below includes pass rates for initial certification completers reported on Title II.
For more information, visit the Title II website:
https://title2.ed.gov/Public/Home.aspx
Title II Summary Pass Rates for Initial Certification
Additional information about certification rates can be found in the measure below for placement rates.
7. Placement Rates: Initial Certification
The placement analyses in the table below feature the count and percentage of initial certification completers who did and did not choose to go into teaching.
Initial Placement Rates by Totals
The "grand total of completers" is the number of students who completed a teacher preparation program for initial certification.The "count of completers who chose to certify after program completion" is the number of completers, and the "certification rate (count of completers who chose to certify/grand total)" is the percentage of completers who submitted an application for institutional recommendation to the associate dean for teacher education. Once the institutional recommendation for certification is signed by the associate dean, the completer's application is forwarded to the Idaho State Department of Education for teacher licensure. These report the number of completers who applied for certification. It does not differentiate who went on to accept teaching positions.
The "placement rate excluding those choosing not to certify from grand total (placement count/grand total-not certified)" is the percentage of certified completers who were verified to be in teaching positions in the following year of completion (e.g., a 2017-2018 completer who can be verified in a teaching position in 2018-2019).
Note: The "placement rate" is calculated simply by dividing the number of completers who are teaching by the number of completers who completed certification. Some completers who certified went on as graduate students, chose not to work in education, or it was not possible to locate any information; these are still included in the denominator of the placement rate calculation.
Of those completers who chose to go into teaching, the placement analyses in the table below includes the count and percentage of completers who are teaching in and out of Idaho.
Rates of Placement Areas
Percentage (and counts) of placement areas for completers who accepted teaching positions in Idaho, out of Idaho, and out of the United States.Of those completers who chose to go into teaching, the placement analyses in the table below includes the count and percentage of completers who are teaching in Idaho.
Click here to see a list of all six Idaho regions.
Rates of Placement in Idaho
Percentage (and counts) of placement areas for completers who accepted teaching positions in Idaho.Of those completers who chose to go into teaching, the placement analyses in the table below includes the count and percentage of completers who are teaching in Idaho’s Region 3.
Click here to see a list of all six Idaho regions.
Rates of Placement in Idaho's Region 3
Rates (and counts) of placement areas for completers who accepted teaching positions in Idaho's Region 3.Initial completers disaggregated by Idaho licensure areas are included in the table below. These licensure areas are aligned with the Title II “Subject Areas” reporting section. For more information about Title II, please visit: https://title2.ed.gov/
Initial Completers by Title II Subject Areas
This table includes the number of initial completers by Title II-defined subject areas for both the traditional and alternative report cards. These subject areas are aligned with Idaho IDAPA categories to best identify the number of completers by Idaho licensure areas.Note: Some completers earned more than one licensure so the total count exceeds the completer totals
8. Consumer Information: Boise State Educator Preparation Programs that Lead to Licensure
Boise State Educator Preparation Programs that Lead to Licensure
*Programs align with the 2024-2025 undergraduate and graduate catalog listings.8. Consumer Information: Student Loan Default Rates
Three-Year Student Loan Default Rate at Boise State and National Averages
Boise State's Office of Financial Aid and Scholarships provides annual default rates for the university and national averages by request.For more information about these rates, please visit the Financial Aid and Scholarships website: https://financialaid.boisestate.edu/
8. Consumer Information: Starting Teacher Salaries in Idaho
Average Teaching Salary in Idaho, and Starting Teacher Salaries in School Districts near Boise State
Note 1: The first row, "Idaho Average Teaching Salary", is an average of ALL teaching salaries in Idaho (across pay scales and districts). The rest of the rows list STARTING teacher salaries for districts near Boise State.Note 2: To the greatest extent possible, teacher salaries are linked to district salary schedules listed online. If you need a PDF document in a different version to be fully accessible, please contact the associated school district for assistance.
8. Consumer Information: Idaho Certification Lookup
The Idaho State Department of Education, Certifications and Professional Standards provides a certification lookup application tool on its website. This application allows for searches for educators who currently hold or have help Idaho certification.
Click here to visit the Idaho Certification Lookup Application website tool.
8. Consumer Information: NASDTEC Interstate Agreement
The National Association of State Directors of Teacher Education and Certification (NASDTEC) interstate agreement is a collection of over 50 individual agreements by states and Canadian provinces that defines which other states’ educator certificates will be accepted by that state.
Click here to visit the NASDTEC interstate agreement website.
8. Consumer Information: What can I do with my certification?
Idaho State Department of Education has created the Idaho System for Educational Excellence (ISEE), a K-12 Longitudinal Data System that helps to deliver information to stakeholders involved in education.
ISEE provides an assignment credential manual that crosswalks types of certification with specific types of education employment opportunities.
Click here to visit the ISEE website.
To reference the 2018-2019 SDE Assignment Credential Manual, go to the ISEE website > ISEE Manuals > 2018-2019 > Assignment Credential Manual.
Click here to reference the 2017-2018 SDE Assignment Credential Manual.
References:
Bill and Melinda GATES Foundation (2010, December). Learning about Teaching: Initial findings from the measures of effective teaching. Retrieved June 2014 from metproject.org: metproject.org/downloads/preliminary_findings_policy_brief.pdf
Bill and Melinda GATES Foundation (2012). MET Project. Retrieved June 2015 from metproject.org: metproject.org.download/Asking_Students_Practioner_Brief.pdf
“Boise State Nationally Recognized for Student Retention, Graduation Rates”, (2017). Focus on Boise State, retrieved from https://focus.boisestate.edu/article/boise-state-nationally-recognized-for-student-retention-graduation-rates/
CCSSO’s Interstate Teacher Assessment and Support Consortium (2013). InTASC: Model Core Teaching Standards and Learning Progressions for Teachers 1.0. (C. o. Officers, Ed.) Washington DC.
Danielson, C. (2013). Enhancing Professional Practice: A Framework for Teaching (2nd ed.). Alexandria, VA: ASCD.
Ferguson, R. (2012). Can student surveys measure teaching quality? Teacher Evaluation, 94 (24).